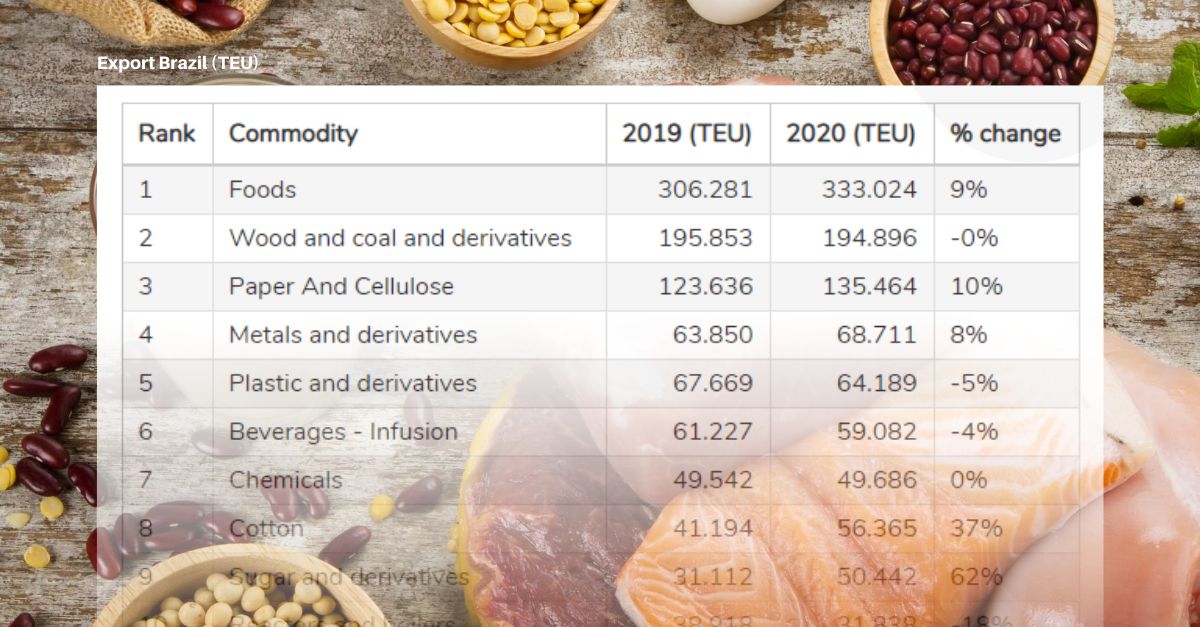
Ranking of containerized commodities traded by Brazil in first semester
Aug, 21, 2020 Posted by datamarnewsWeek 202034
In a year of great economic uncertainties caused by the coronavirus pandemic, some goods stand out in the ranking of containerized commodities most traded in the first half of 2020 compared to the same period in 2019. See below for the latest ranking of exported and imported products via container in the first semester of 2020 year-on-year:
Ranking for exported goods: January to June 2020
Food ranks first as the most exported category in 2020, with 9% growth compared to year-ago levels. Other categories that were growth drivers for exports were cotton, with 37% growth, and sugar, which grew 62% compared to the same period in 2019.
wdt_ID | Rank | Commodity | 2019 (TEU) | 2020 (TEU) | % change |
---|---|---|---|---|---|
1 | 1 | Foods | 306.281 | 333.024 | 9% |
2 | 2 | Wood and coal and derivatives | 195.853 | 194.896 | -0% |
3 | 3 | Paper And Cellulose | 123.636 | 135.464 | 10% |
4 | 4 | Metals and derivatives | 63.850 | 68.711 | 8% |
5 | 5 | Plastic and derivatives | 67.669 | 64.189 | -5% |
6 | 6 | Beverages - Infusion | 61.227 | 59.082 | -4% |
7 | 7 | Chemicals | 49.542 | 49.686 | 0% |
8 | 8 | Cotton | 41.194 | 56.365 | 37% |
9 | 9 | Sugar and derivatives | 31.112 | 50.442 | 62% |
10 | 10 | Reactors and boilers | 38.918 | 31.838 | -18% |
11 | 11 | Minerals and derivatives | 27.741 | 23.556 | -15% |
12 | 12 | Animal food | 23.734 | 24.430 | 3% |
13 | 13 | Textiles, derivatives and clothing | 24.726 | 21.716 | -12% |
14 | 14 | Rubber and derivatives | 26.917 | 18.746 | -30% |
15 | 15 | Smoke | 24.618 | 19.164 | -22% |
16 | Total | 1.107.021 | 1.151.312 | 4% | |
17 | Others | 175.998 | 166.747 | -5% | |
18 | Grand Total | 1.283.018 | 1.318.059 | 3% |
Source: DataLiner
Ranking of imported goods: January to June 2020
Among the most imported goods, the most significant changes were a 49% rise in fertilizer trade, and a 23% drop vehicles and auto parts as well as in textile products.
wdt_ID | Rank | Commodity | 2019 (TEU) | 2020 (TEU) | % change |
---|---|---|---|---|---|
1 | 1 | Plastic and derivatives | 133.702 | 134.891 | 1% |
2 | 3 | Chemicals | 115.781 | 121.877 | 5% |
3 | 4 | Reactors and boilers | 113.956 | 107.270 | -6% |
4 | 2 | Vehicles and parts | 138.227 | 106.934 | -23% |
5 | 5 | Electric machines | 84.687 | 88.591 | 5% |
6 | 6 | Metals and derivatives | 76.751 | 71.761 | -7% |
7 | 7 | Textiles, derivatives and clothing | 82.660 | 63.324 | -23% |
8 | 8 | Foods | 46.318 | 44.242 | -4% |
9 | 9 | Rubber and derivatives | 45.416 | 36.617 | -19% |
10 | 10 | Paper And Cellulose | 31.739 | 33.393 | 5% |
11 | 11 | Fertilizer | 22.009 | 32.793 | 49% |
12 | 13 | Salt, plaster, cement | 15.013 | 17.132 | 14% |
13 | 12 | Glass and derivatives | 20.358 | 16.790 | -18% |
14 | 15 | Drinks | 14.937 | 14.312 | -4% |
15 | 14 | Furniture | 18.200 | 13.697 | -25% |
16 | Total | 959.753 | 903.626 | -6% | |
17 | Others | 182.210 | 164.055 | -10% | |
18 | Grand total | 1.141.963 | 1.067.680 | -7% |
-
Oil and Gas
Dec, 29, 2021
0
Mexico will no longer export oil from 2023 onwards
-
Shipping
Aug, 30, 2021
0
Waterway sector forecasts losses of R$ 3 billion with the stoppage of the Tietê-Paraná Waterway
-
Ports and Terminals
Dec, 10, 2019
0
Port of Itaqui receives the largest fuel ship
-
Ports and Terminals
Oct, 22, 2021
0
Companhia Docas da Paraíba opens public consultation for construction of a truck regulation yard