Port terminal rankings for Jan-Sept 2020 & 2019
Nov, 12, 2020 Posted by Ruth HollardWeek 202047
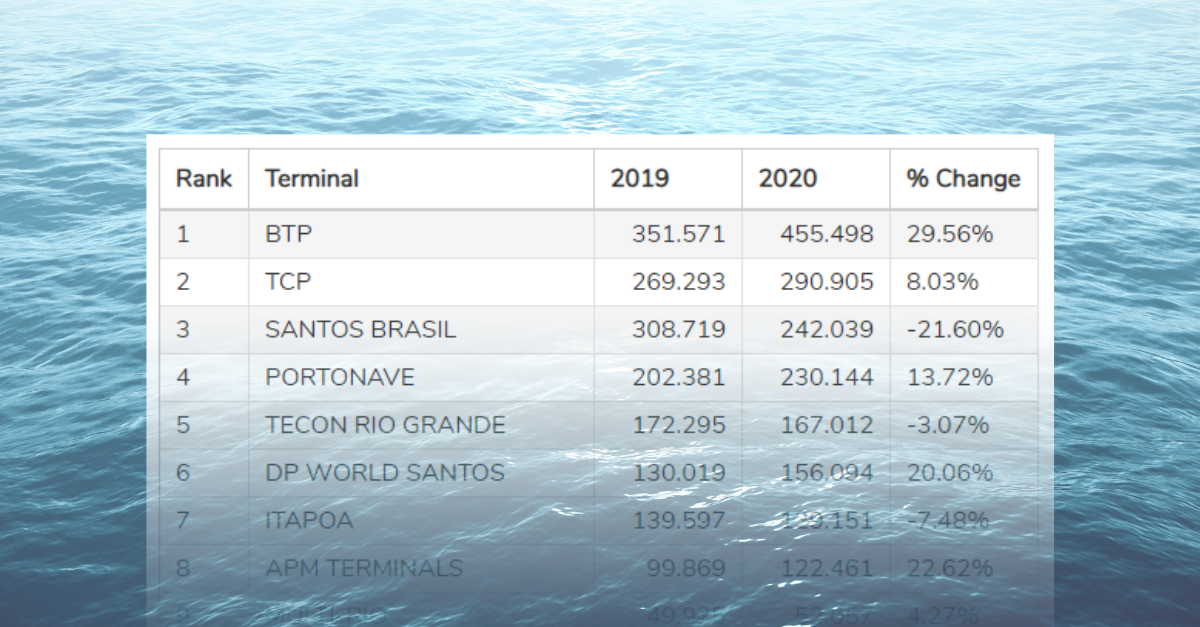
Below is a ranking of the port terminals that stood out the most in container handling in the first nine months of 2020 and their comparison with the same period in 2019 according to DataLiner data:
In exports, the biggest highlight remains BTP, which grew 29.56% in the period from January to September 2020 compared to the same period in 2019. Despite maintaining the third position in the ranking, Santos Brasil presented the biggest drop in the period: -21.60%:
Port Terminal Rankings – Exports | Jan-Sept 2020 & 2019| TEU
wdt_ID | Rank | Terminal | 2019 | 2020 | % Change |
---|---|---|---|---|---|
1 | 1 | BTP | 351.571 | 455.498 | 29.56% |
2 | 2 | TCP | 269.293 | 290.905 | 8.03% |
3 | 3 | SANTOS BRASIL | 308.719 | 242.039 | -21.60% |
4 | 4 | PORTONAVE | 202.381 | 230.144 | 13.72% |
5 | 5 | TECON RIO GRANDE | 172.295 | 167.012 | -3.07% |
6 | 6 | DP WORLD SANTOS | 130.019 | 156.094 | 20.06% |
7 | 7 | ITAPOA | 139.597 | 129.151 | -7.48% |
8 | 8 | APM TERMINALS | 99.869 | 122.461 | 22.62% |
9 | 9 | MULTI-RIO | 49.925 | 52.057 | 4.27% |
10 | 10 | TECON SALVADOR | 58.293 | 60.679 | 4.09% |
11 | 11 | TEC P1 | 36.740 | 35.539 | -3.27% |
12 | 12 | LIBRA TERMINAL | 26.607 | 24.192 | -9.08% |
13 | 13 | SEPETIBA TECON | 19.804 | 18.665 | -5.75% |
14 | 14 | TECON SUAPE | 10.205 | 10.776 | 5.60% |
15 | 15 | CAIS PUBLICO FORTALEZA | 15.073 | 12.367 | -17.95% |
16 | TOTAL | 1.890.389 | 2.007.579 | 6.20% | |
17 | OTHERS | 87.370 | 54.312 | -37.84% | |
18 | GRAND TOTAL | 1.977.759 | 2.061.891 | 4.25% |
Source: DataLiner
The terminal that received the most imported cargo in the first nine months of 2020 was also BTP, but with a drop of 15.77% in handling. In general, most terminals registered a drop in imports, due to the economic upheavals caused by the Covid-19 pandemic.
Port Terminal Rankings – Imports | | Jan-Sept 2020 & 2019| TEU
wdt_ID | Rank | Terminal | 2019 | 2020 | % Change |
---|---|---|---|---|---|
1 | 1 | BTP | 347.178 | 292.439 | -15.77% |
2 | 2 | SANTOS BRASIL | 331.903 | 282.681 | -14.83% |
3 | 3 | TCP | 179.706 | 166.291 | -7.47% |
4 | 4 | PORTONAVE | 163.761 | 145.739 | -11.01% |
5 | 5 | DP WORLD SANTOS | 103.666 | 124.712 | 20.30% |
6 | 6 | ITAPOA | 139.207 | 121.173 | -12.95% |
7 | 7 | APM TERMINALS | 78.370 | 86.522 | 10.40% |
8 | 8 | TERMINAL CHIBATAO | 56.059 | 59.726 | 6.54% |
9 | 9 | TECON RIO GRANDE | 55.717 | 45.029 | -19.18% |
10 | 10 | MULTI-RIO | 58.059 | 44.714 | -22.99% |
11 | 11 | TECON SUAPE | 54.164 | 43.924 | -18.91% |
12 | 12 | LIBRA TERMINAL | 46.171 | 41.528 | -10.06% |
13 | 13 | TECON SALVADOR | 42.335 | 35.622 | -15.86% |
14 | 14 | SEPETIBA TECON | 48.264 | 33.535 | -30.52% |
15 | 15 | SUPER TERMINAIS | 39.121 | 33.333 | -14.79% |
16 | TOTAL | 1.743.682 | 1.556.969 | -10.71% | |
17 | OTHERS | 56.052 | 24.506 | -56.28% | |
18 | GRAND TOTAL | 1.799.734 | 1.581.475 | -12.13% |
Source: DataLiner (To request a DataLiner demo click here)
-
Steel and Aluminium
Jun, 18, 2021
0
Crude steel exports up 21% in revenue, generating sales of $3 bi YTD
-
Ports and Terminals
Oct, 24, 2023
0
Itajaí Port Complex records 1.3 million tonnes in September
-
OTI Rankings
Oct, 14, 2020
0
DataLiner OTI Rankings (NVO Rankings) | Jan to Aug 2019-2020 Brazil and Plate
-
Ports and Terminals
Nov, 24, 2023
0
Ports in Rio Grande do Sul Report Growth Across the Board from January to October