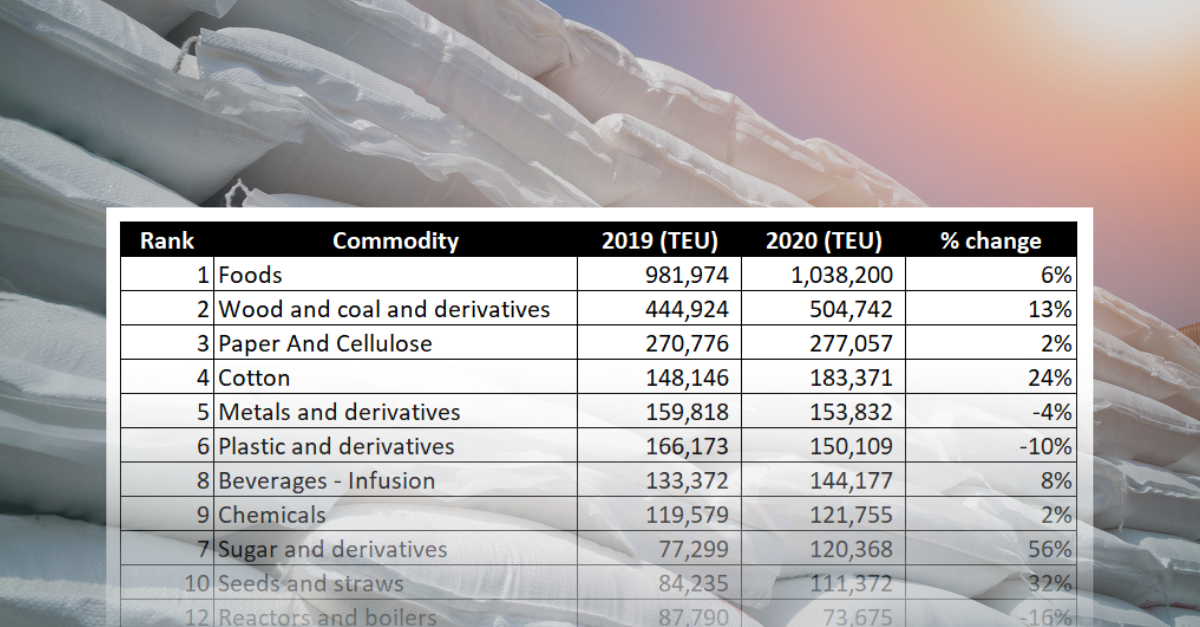
TEU ranking of Brazil exports and imports in 2020
Feb, 24, 2021 Posted by Ruth HollardWeek 202108
Which goods were handled in the highest volumes in 2020? Which products had the greatest growth in exports? And the biggest drop? To answer these questions, the DatamarNews team conducted a ranking of the most-exported and most-imported goods in 2020 and drew a comparison with 2019. See the results below:
Exports
In exports, food was the category that performed the best in 2020, with 1,038,200 TEU, a growth of 6% in relation to 2019. The highest percentage growth, however, was registered in the ‘sugar and derivatives’ category, which grew 56%.
Ranking of Brazil’s exports | Jan to December 2019-2020 | TEU
Source: DataLiner
Imports
The goods most imported by Brazil in containers in 2020 were from the ‘plastics and derivatives’ category. At 377,538 TEU, this was a 6% growth compared to 2019. In contrast, the ‘rubbers and derivatives’ category fell 18% in 2020 compared to 2019.
Ranking of Brazil’s imports | Jan to December 2019-2020 | TEU
Source: DataLiner (To request a DataLiner demo click here)
-
Meat
May, 13, 2020
0
Brazil’s pork exports to China grow 19% in April
-
Grains
Aug, 16, 2021
0
Paraná producers must import corn after drought
-
Ports and Terminals
Aug, 17, 2022
0
Key equipment to remain at the Port of Itajaí during transitional lease
-
Ports and Terminals
Dec, 17, 2021
0
Itaqui port grows at 27% rate from January to October

