Ranking of Ports | DataLiner | Jan-Nov 2022 vs Jan-Nov 2021 | Brazil and Plate
Jan, 24, 2023 Posted by Gabriel MalheirosWeek 202304
See below the ranking of ports in Brazil and the Plate region that most exported and imported containers from January to November 2022 and its comparison with the same period of 2021. The data is from DataLiner, Datamar’s business intelligence tool:
Brazil ports
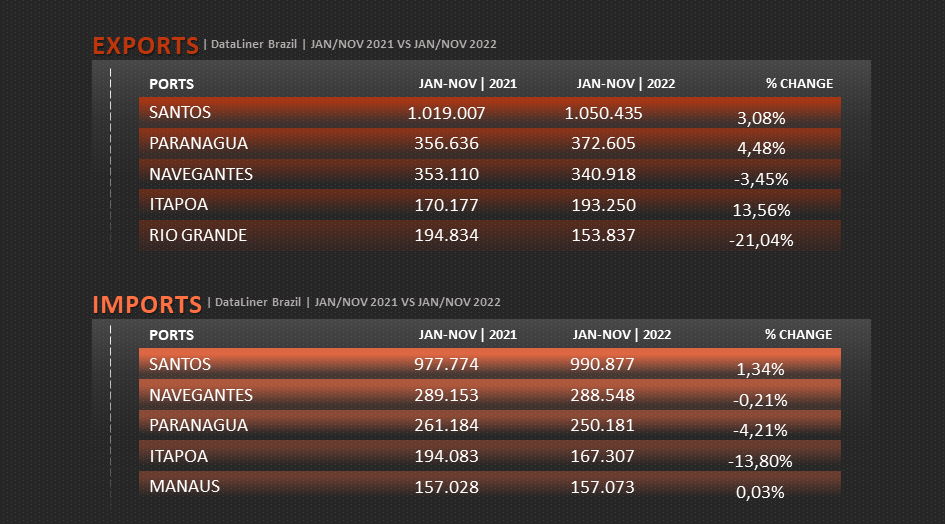
The Port of Santos continues to lead Brazilian exports via containers, with a 1,050,435 TEU throughput in the first 11 months of 2022, a volume 3.08% greater than in the same period of 2021. The Port of Paranaguá, second in the exports ranking, sent 372,605 TEUs to other countries, a volume 4.48% higher than that from January to November 2021. Check out the other ports in Brazil below:
Ranking of Brazilian Ports | Exports | Jan-Nov 2021 vs. Jan-Nov 2022 | TEU
Source: DataLiner (click here to request a demo)
The growth in imported volumes via the Port of Santos was lower than in exports: 1.34% compared to the first 11 months of 2021, with 990,877 TEUS. The Port of Navegantes, second in the ranking, imported 288,548 TEUS, a volume 0.21% lower than in the same period of 2021. See more of the ranking of ports in Brazil below:
Ranking of Brazilian Ports | Imports | Jan-Nov 2021 vs. Jan-Nov 2022 | TEU
Source: DataLiner (click here to request a demo)
Plate
In the other countries on the East Coast of South America (Argentina, Paraguay, and Uruguay), the port that carried out the most export activities via containers was the Port of Buenos Aires, with 336,773 TEUs dispatched between January and November 2022. This figure is 6.53% lower than the same period in 2021. Comparatively, the Port of Montevideo, second in the ranking, exported volumes 1.85% higher than in 2021. See the ranking below:
Ranking of Ports in the Plate region | Exports | Jan-Nov 2021 vs. Jan-Nov 2022 | TEU
Source: DataLiner (click here to request a demo)
As for container imports, the Port of Buenos Aires had a 518,480 TEU movement from January to November 2022, a volume 4.44% higher than the same period in 2021. On the other hand, the Port of Montevideo, with 209,940 TEUs, imported a volume of 4.55 % in the same comparison. See more below:
Ranking of Ports in the Plate region | Imports | Jan-Nov 2021 vs. Jan-Nov 2022 | TEU
-
Grains
Oct, 13, 2021
0
Soybean imports in China fall 30% in September as demand slows
-
Ores
Jul, 03, 2019
0
Brazil’s exports of iron ore down 16.7% in June
-
Blog News (ENG)
Feb, 23, 2024
0
Brazilian banana exports struggle with sluggish start in 2024
-
Environment
Feb, 22, 2024
0
Sustainable production criteria could boost sales to China

