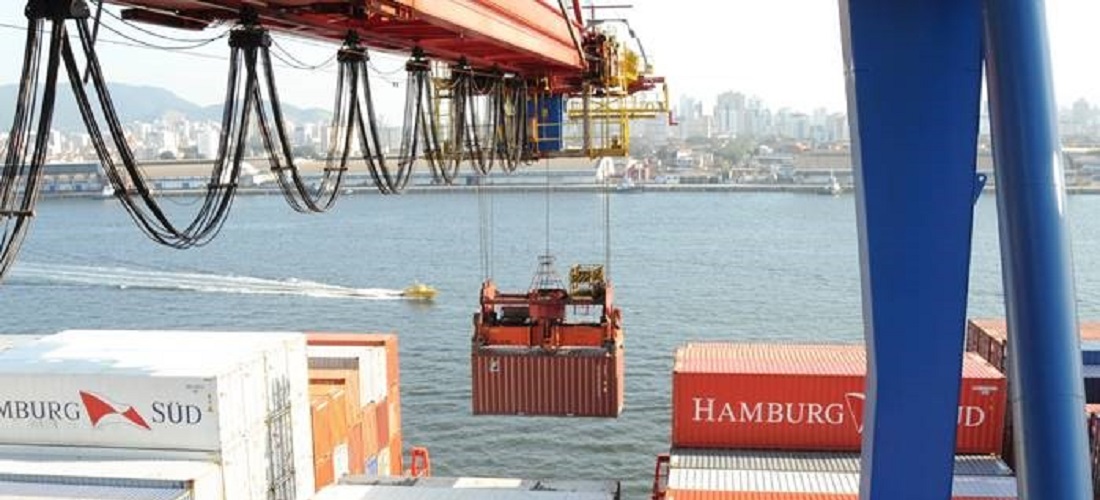
2.7 million TEU handled by Brazil`s ports in 2019
Mar, 08, 2020 Posted by Sylvia SchandertWeek 202011
According to DataLiner, Datamar`s foreign intelligence system, a total of 2.7 million TEU were exported via Brazil`s ports in 2019, with Santos exporting the most at 1.06 TEU, followed by Paranaguá with 364,525 TEU. It is worth noting that exports via the Port of Paranaguá in 2019 were 13.5% higher than in 2018, when 321,061 TEU were shipped. Another highlight in 2019 was a 24.8% year-on-year increase in the volume exported via Pecém at 26,711 TEU.
TEU by Port DataLiner | 2018 vs 2019 | Exports Brazil
| Top POMO | 2018 | 2019 | %-diff | ||||
|---|---|---|---|---|---|---|---|
| 1 | SANTOS | SANTOS | 1.027.388 | 1.057.368 | 2,92 | ||
| 2 | PARANAGUA | PARANAGUA | 321.061 | 364.525 | 13,54 | ||
| 3 | NAVEGANTES | NAVEGANTES | 285.525 | 273.380 | -4,25 | ||
| 4 | ITAPOA | RIO GRANDE | 229.847 | 234.083 | 1,84 | ||
| 5 | MANAUS | ITAPOA | 204.194 | 182.444 | -10,65 | ||
| 6 | RIO DE JANEIRO | ITAJAI | 115.818 | 137.386 | 18,62 | ||
| 7 | SUAPE | RIO DE JANEIRO | 91.889 | 97.346 | 5,94 | ||
| 8 | ITAJAI | SALVADOR | 99.229 | 96.139 | -3,11 | ||
| 9 | RIO GRANDE | VITORIA | 64.712 | 67.830 | 4,82 | ||
| 10 | SALVADOR | VILA DO CONDE | 52.766 | 53.936 | 2,22 | ||
| 11 | VITORIA | PORTO DE ITAGUAI | 44.852 | 32.038 | -28,57 | ||
| 12 | PORTO DE ITAGUAI | NATAL | 27.767 | 22.418 | -19,26 | ||
| 13 | PECEM | SUAPE | 25.978 | 22.290 | -14,20 | ||
| 14 | VILA DO CONDE | FORTALEZA | 24.145 | 26.074 | 7,99 | ||
| 15 | IMBITUBA | PECEM | 21.400 | 26.711 | 24,82 | ||
| 16 | FORTALEZA | MANAUS | 17.465 | 17.259 | -1,18 | ||
| 17 | NATAL | IMBITUBA | 19.849 | 1.585 | -92,01 | ||
| 18 | PORTO ALEGRE | BELEM | 4 | 374 | 9.250,00 | ||
| 19 | OTHERS | OTHERS | 909 | 157 | -82,73 | ||
| ∑ = 2.674.798 | ∑ = 2.713.343 |
Imports
On the import side, Santos received the most cargo at 966,648 TEU, a volume 0.29% lower than in 2018, followed by Paranaguá which grew 1.81%, reaching 246,107 TEU. Meanwhile, the Port of Itajaí registered an 83.46% rise in the volume imported compared to 2018, reaching 116,283 TEU.
TEU by Port DataLiner | 2018 vs 2019 | Imports Brazil
| Top POMD | 2018 | 2019 | %-diff | |
|---|---|---|---|---|
| 1 | SANTOS | 969.421 | 966.648 | -0,29 |
| 2 | PARANAGUA | 241.737 | 246.107 | 1,81 |
| 3 | NAVEGANTES | 244.692 | 222.429 | -9,10 |
| 4 | ITAPOA | 149.180 | 186.718 | 25,16 |
| 5 | MANAUS | 135.716 | 156.599 | 15,39 |
| 6 | RIO DE JANEIRO | 128.321 | 131.288 | 2,31 |
| 7 | SUAPE | 81.067 | 82.161 | 1,35 |
| 8 | ITAJAI | 63.384 | 116.283 | 83,46 |
| 9 | RIO GRANDE | 78.400 | 77.871 | -0,67 |
| 10 | SALVADOR | 61.318 | 71.062 | 15,89 |
| 11 | VITORIA | 60.754 | 63.271 | 4,14 |
| 12 | PORTO DE ITAGUAI | 43.484 | 40.439 | -7,00 |
| 13 | PECEM | 29.803 | 31.684 | 6,31 |
| 14 | VILA DO CONDE | 6.578 | 7.665 | 16,52 |
| 15 | IMBITUBA | 4.902 | 1.007 | -79,46 |
| 16 | FORTALEZA | 3.480 | 2.346 | -32,59 |
| 17 | NATAL | 1.102 | 857 | -22,23 |
| 18 | PORTO ALEGRE | 374 | 350 | -6,42 |
| 19 | OTHERS | 356 | 438 | 23,03 |
| ∑ = 2.304.069 | ∑ = 2.405.223 |
-
Economy
Jan, 04, 2021
0
Brazilian imports grow in November 2020 after falling for months
-
Ports and Terminals
Apr, 24, 2024
0
Itajaí-Açu River Port Complex Welcomes New Suction Dredger
-
Economy
Aug, 19, 2022
1
Exports: Brazil buys 36% of Paraguay shipments
-
Automotive
Jan, 13, 2025
0
Cars and Coffee Drive Espírito Santo’s Foreign Trade to Historic Records in 2024

