Brazil and Plate Port Rankings – January-July 2021
Sep, 20, 2021 Posted by Sylvia SchandertWeek 202137
The port rankings below show the Brazilian and Plate ports that exported and imported the most containers in the first seven months of 2021 compared with the same period last year:
Brazil
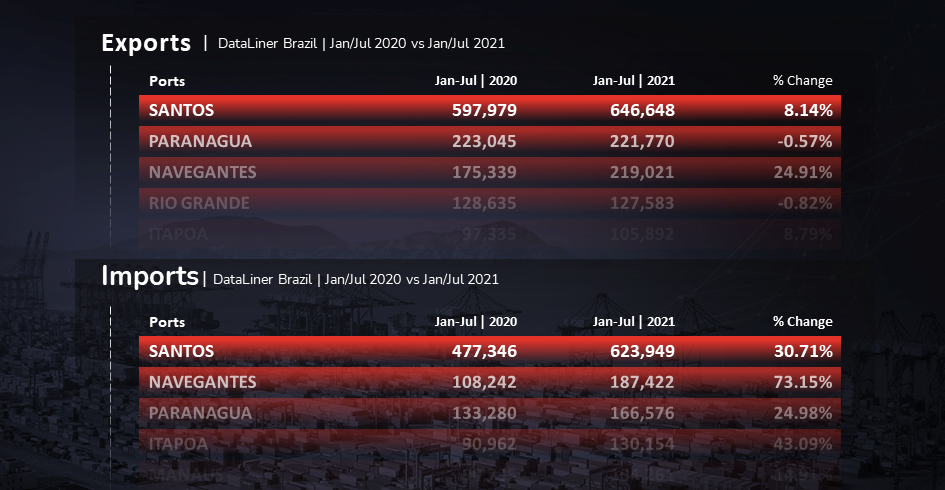
The Port of Santos tops the ranking for Brazilian exports, with 646,648 TEU exported during the 7-month period this year – an increase of 8.14% over the same period last year. Proportionally, the biggest growth in the period was the Port of Fortaleza, which grew 54.31% over the period comparison as shown below:
Brazilian Port Ranking | Exports | Jan-Jul 2021 vs. Jan-Jul 2020 | TEU
wdt_ID | Rank | Ports | Jan-Jul | 2020 | Jan-Jul | 2021 | % Change |
---|---|---|---|---|---|
1 | 1 | SANTOS | 597,979 | 646,648 | 8.14% |
2 | 2 | PARANAGUA | 223,045 | 221,770 | -0.57% |
3 | 3 | NAVEGANTES | 175,339 | 219,021 | 24.91% |
4 | 4 | RIO GRANDE | 128,635 | 127,583 | -0.82% |
5 | 5 | ITAPOA | 97,335 | 105,892 | 8.79% |
6 | 6 | ITAJAI | 93,802 | 85,571 | -8.77% |
7 | 7 | RIO DE JANEIRO | 51,660 | 50,043 | -3.13% |
8 | 8 | SALVADOR | 54,650 | 46,136 | -15.58% |
9 | 9 | VITORIA | 40,175 | 39,573 | -1.50% |
10 | 10 | VILA DO CONDE | 28,882 | 34,426 | 19.20% |
11 | 11 | PECEM | 12,592 | 16,738 | 32.93% |
12 | 12 | FORTALEZA | 10,568 | 16,308 | 54.31% |
13 | 13 | SUAPE | 13,846 | 15,381 | 11.09% |
14 | 14 | ITAGUAI | 14,978 | 14,329 | -4.33% |
15 | 15 | MANAUS | 8,198 | 10,399 | 26.85% |
16 | 16 | NATAL | 8,783 | 9,025 | 2.76% |
17 | OTHERS | 541 | 525 | -2.96% |
Source: DataLiner (click here to request a demo)
On the import side, the Port of Santos had even more positive results: 30.71% growth compared to the first seven months of 2020, with 623,949 imported. The Port of Navegantes was second in the ranking, growing 73.15% over the same period comparison.
Brazilian Port Ranking | Imports | Jan-Jul 2021 vs. Jan-Jul 2020 | TEU
wdt_ID | Rank | Ports | Jan-Jul | 2020 | Jan-Jul | 2021 | % Change |
---|---|---|---|---|---|
1 | 1 | SANTOS | 477,346 | 623,949 | 30.71% |
2 | 2 | NAVEGANTES | 108,242 | 187,422 | 73.15% |
3 | 3 | PARANAGUA | 133,280 | 166,576 | 24.98% |
4 | 4 | ITAPOA | 90,962 | 130,154 | 43.09% |
5 | 5 | MANAUS | 90,735 | 104,261 | 14.91% |
6 | 6 | ITAJAI | 72,956 | 96,369 | 32.09% |
7 | 7 | RIO DE JANEIRO | 61,052 | 72,124 | 18.13% |
8 | 8 | SUAPE | 40,740 | 53,170 | 30.51% |
9 | 9 | SALVADOR | 36,189 | 45,120 | 24.68% |
10 | 10 | RIO GRANDE | 38,258 | 42,656 | 11.50% |
11 | 11 | VITORIA | 28,982 | 33,999 | 17.31% |
12 | 12 | PECEM | 18,845 | 18,676 | -0.90% |
13 | 13 | ITAGUAI | 13,353 | 11,567 | -13.38% |
14 | 14 | VILA DO CONDE | 4,699 | 4,022 | -14.41% |
15 | 15 | FORTALEZA | 789 | 1,214 | 53.87% |
16 | 16 | NATAL | 294 | 221 | -24.96% |
17 | OTHERS | 680 | 329 | -51.62% |
Source: DataLiner (click here to request a demo)
Plate
The Port of Buenos Aires leads exports in the Plate region, with 224,883 TEU shipped abroad in the first seven months of 2021, down 5% from the same period in 2020. The Port of Montevideo was ranked second, with 6.78% growth over the same period comparison.
Plate Region Port Ranking | Exports | Jan-Jul 2021 vs. Jan-Jul 2020 | TEU
wdt_ID | Rank | Ports | Jan-Jul | 2020 | Jan-Jul | 2021 | % Change |
---|---|---|---|---|---|
1 | 1 | BUENOS AIRES | 236,717 | 224,883 | -5.00% |
2 | 2 | MONTEVIDEO | 119,186 | 127,262 | 6.78% |
3 | 3 | ZARATE | 19,216 | 19,456 | 1.25% |
4 | 4 | SAN ANTONIO ESTE | 13,334 | 12,748 | -4.40% |
5 | 5 | ROSARIO | 11,265 | 9,084 | -19.36% |
6 | 6 | PUERTO MADRYN | 4,360 | 3,779 | -13.33% |
7 | 7 | BAHIA BLANCA | 5,438 | 3,608 | -33.65% |
8 | 8 | LA PLATA | 587 | 1,204 | 105.11% |
Source: DataLiner (click here to request a demo)
For imports, the Port of Buenos Aires grew 21.97% during the period, reaching 323,576 TEU handled. Meanwhile, Montevideo Port grew 37.4% over the same period comparison.
Plate Region Port Ranking | Imports | Jan-Jul 2021 vs. Jan-Jul 2020 | TEU
wdt_ID | Rank | Ports | Jan-Jul | 2020 | Jan-Jul | 2021 | % Change |
---|---|---|---|---|---|
1 | 1 | BUENOS AIRES | 265,288 | 323,576 | 21.97% |
2 | 2 | MONTEVIDEO | 80,283 | 110,307 | 37.40% |
3 | 3 | ZARATE | 25,600 | 28,868 | 12.76% |
4 | 4 | ROSARIO | 10,789 | 14,761 | 36.81% |
5 | 5 | USHUAIA | 8,983 | 10,189 | 13.43% |
6 | 6 | PUERTO MADRYN | 1,499 | 1,134 | -24.35% |
7 | 7 | PUERTO DESEADO | 314 | 267 | -14.97% |
8 | 8 | BAHIA BLANCA | 109 | 148 | 35.78% |
9 | 9 | MAR DEL PLATA | 73 | 140 | 91.78% |
10 | 10 | LAS PALMAS +AR | 17 | 114 | 570.59% |
11 | 11 | SANTA FE | 21 | 48 | 128.57% |
12 | 12 | LA PLATA | 0 | 8 | 100.00% |
13 | 13 | CAMPANA | 0 | 5 | 100.00% |
-
Meat
Oct, 19, 2022
0
Brazil: beef exports reach 91,159 tonnes in Oct
-
Shipping
Sep, 01, 2020
0
Maersk to discontinue the Safmarine and Damco brands by the end of 2020
-
Other Logistics
Mar, 29, 2021
0
Cascavel to be logistics hub for Nova Ferroeste
-
Shipping
Feb, 20, 2024
0
FT: Container lines ‘struggling’ with port congestion and ship shortages