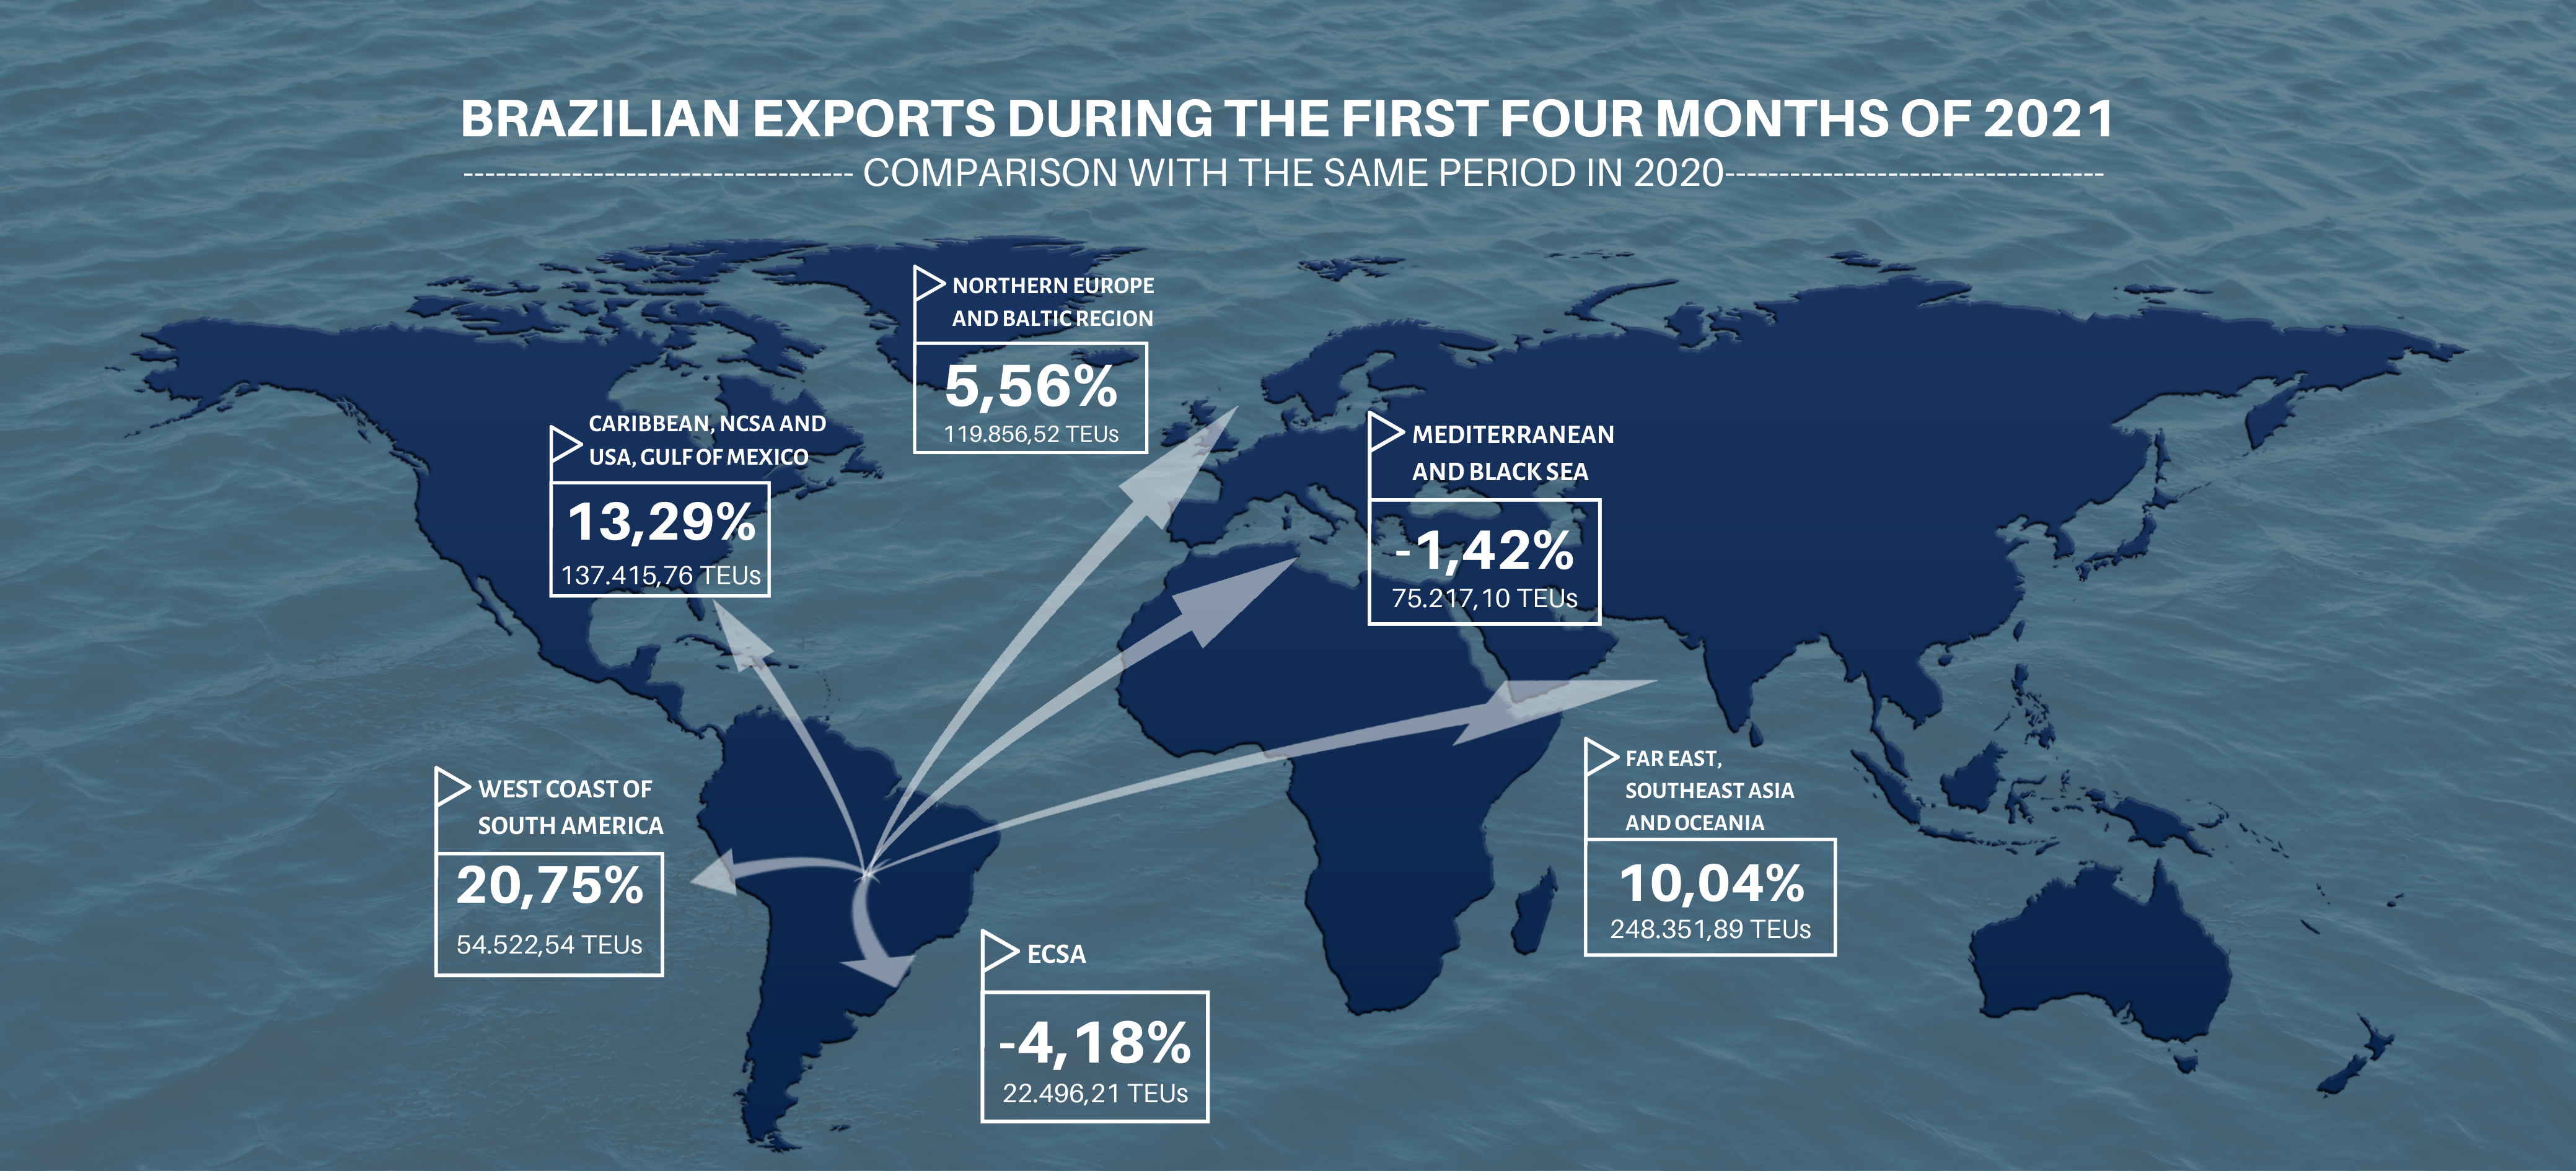
Brazilian container movement by trade lanes in the first quarter of 2021
Jun, 15, 2021 Posted by Ruth HollardWeek 202125
How has the disruption of world maritime trade due to the Covid-19 pandemic, the Suez Canal incident, and the current traffic jams in China affected Brazil’s trade with its trading partners? To answer this question, the DatamrNews team prepared a history of the Brazilian container movement by trade lane, prepared with data from DataLiner:
The Mediterranean and the Black Sea
In this range of trade, exports fell 1.42% in the first four months of 2021 compared to the same period in 2020:
Total Exports and Imports – to and from the Mediterranean & Black Seas – Jan 2006 to Apr 2021 (TEU)
Graph source: DataLiner (To request a DataLiner demo click here)
The Far East, Southeast Asia, and OceaniaAll news
This trade lane saw a 10.04% growth in exports in the first four months of 2021 compared to the same months of 2020:
Total Exports and Imports – to and from the Far East and South East Asia – Jan 2006 to Apr 2021 (TEU)
Graph source: DataLiner (To request a DataLiner demo click here)
Northern Europe and Baltic region
In Northern Europe and the Baltic region, export growth was 5.56%:
Total Exports and Imports – to and from North Europe & the Baltic – Jan 2006 to Apr 2021 (TEU)
Graph source: DataLiner (To request a DataLiner demo click here)
Southeast Africa, Middle East, and Indian subcontinent
In this trade lane, there was a 3.53% drop in exports in the January-April 2020 and 2021 comparison:
Total Exports and Imports – to and from South & East Africa – Jan 2006 to Apr 2021 (TEU)
Graph source: DataLiner (To request a DataLiner demo click here)
Western Africa
In this range of trade, there was a growth of 9.56% in exports in the first four months of 2021:
Total Exports and Imports – to and from West Africa – Jan 2006 to Apr 2021 (TEU)
Graph source: DataLiner (To request a DataLiner demo click here)
Caribbean
Here, the growth in exports was 9.04% in the January-April 2020 and 2021 comparison:
Total Exports and Imports – to and from the Caribbean – Jan 2006 to Apr 2021 (TEU)
Graph source: DataLiner (To request a DataLiner demo click here)
South America West Coast
This trade lane showed an expressive growth of 20.75% in exports in the first four months of 2021 compared to the same period in 2020:
Total Exports and Imports – to and from West Coast South America – Jan 2006 to Apr 2021 (TEU)
Graph source: DataLiner (To request a DataLiner demo click here)
ECSA
In the East Coast region of South America, there was a 4.18% drop in exports in the period from January to April 2021 compared to the same months in 2020:
Total Exports and Imports – to and from ECSA – Jan 2006 to Apr 2021 (TEU)
Graph source: DataLiner (To request a DataLiner demo click here)
-
Ores
Jan, 02, 2024
0
Iron ore set on ascendant path in 2024
-
Automotive
Apr, 06, 2020
0
Anfavea data reveals extent of Coronavirus impact on automotive industry in March
-
Grains
Aug, 18, 2021
0
Argentina 2020/21 soybean sales reach 27.3 million tons
-
Ports and Terminals
Jul, 21, 2021
0
Equipment to monitor sea currents and waves is installed at Imbituba

