Brazilian port container imports up 11.2% in the first two months
Apr, 20, 2021 Posted by Neeharika KhaitanWeek 202117
Datamar data show that full-container imports via Brazilian ports grew 11.2% during the first two months of 2021 compared to the same period in 2020. Container exports also increased, by almost 5%.
Exports
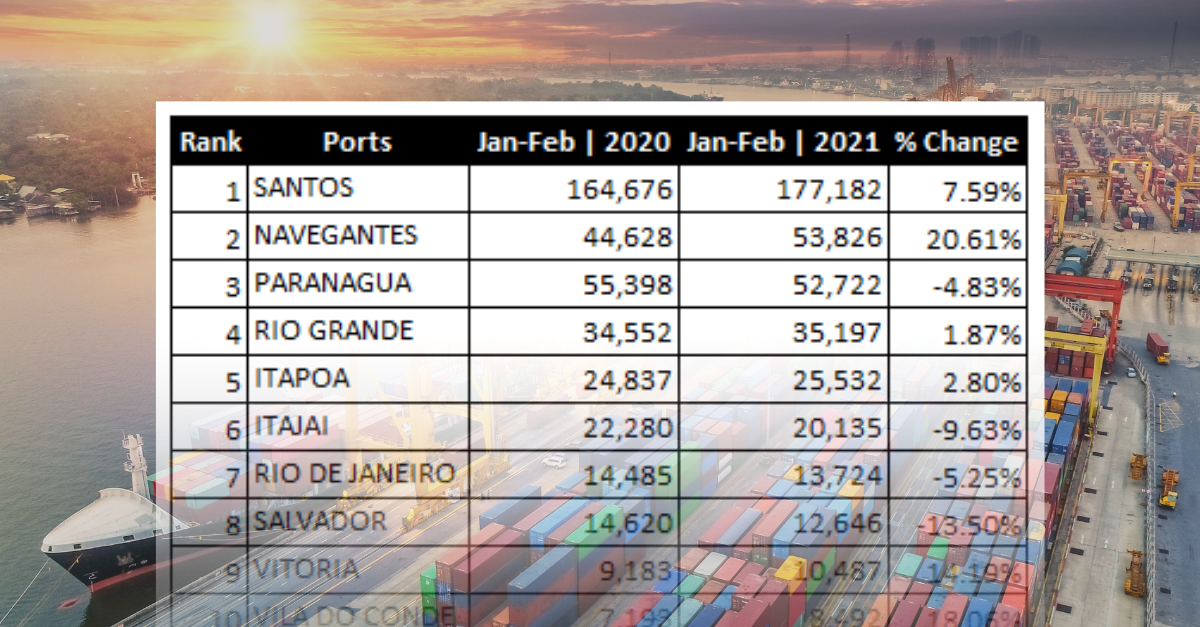
In terms of exports, the port that grew the most in absolute terms was Santos, jumping 12,000 TEU during the period, an increase of 7.59%. Handling at Navegantes grew even more in terms of percentage, growing 20.61% in the same period. Another highlight was the growth of the ports in Fortaleza, both Pecém and Fortaleza itself. Pecém increased its exports by 31% while Fortaleza grew by 39%. Together, the two ports exported more than 13,000 TEU and exceeded the volume of Salvador – almost reaching the handling level of the Port of Rio de Janeiro.
Ranking of Brazilian Ports – Exports | Jan and Feb 2020-2021 | TEU
Imports
In terms of imports, the Port of Santos registered the highest increase, growing by almost 15,000 TEU. The Port of Navegantes again registered the highest increase in percentage, growing an incredible 45%. Paranaguá and Itapoá also increased handling to 11% and 23%, respectively. The fact that imports were low last year during the initial months of the Covid-19 pandemic accounts for a large part of these increases.
Ranking of Brazilian Ports – Imports | Jan and Feb 2020-2021 | TEU
Plate
The scenario was troubling for exports from Plate ports. The port handling fell by almost 6%. All ports registered decreases.
Ranking of Plate Ports – Exports | Jan and Feb 2020-2021 | TEU
| Rank | Porto | Jan-Fev | 2020 | Jan-Fev | 2021 | % Mudança | |
|---|---|---|---|---|---|
| 1 | 1 | BUENOS AIRES | 63.205 | 60.146 | -4.84% |
| 2 | 2 | MONTEVIDEO | 30.479 | 28.891 | -5.21% |
| 3 | 3 | ZARATE | 4.093 | 4.239 | 3.57% |
| 4 | 4 | SAN ANTONIO ESTE | 3.638 | 3.436 | -5.56% |
| 5 | 5 | ROSARIO | 3.569 | 2.384 | -33.20% |
| 6 | 6 | PUERTO MADRYN | 1.368 | 1.507 | 10.16% |
| 7 | 7 | BAHIA BLANCA | 1.047 | 783 | -25.21% |
| 8 | 8 | LA PLATA | 385 | 45 | -88.31% |
| ∑ = 107.784 | ∑ = 101.431 |
Plate imports registered impressive increases compared to 2020 levels, growing 8.8% during the first two months compared to the same period in 2020. Buenos Aires grew by almost 5,000 TEU, or 5.63%. Montevideo grew an impressive 19.40%
Ranking of Plate Ports – Imports | Jan and Feb 2020-2021 | TEU
-
Economy
Sep, 06, 2024
0
Brazil greenlights creation of 11 new agricultural attachés abroad
-
Automotive
Sep, 13, 2023
0
Brazilian auto parts market down 2% in imports; exports up 18.6%
-
Shipping
Jul, 24, 2019
0
Bulk ocean freight rates rise
-
Other Cargo
May, 09, 2022
0
Cotton: increased prices and difficulty in passing on costs lead to production cuts

