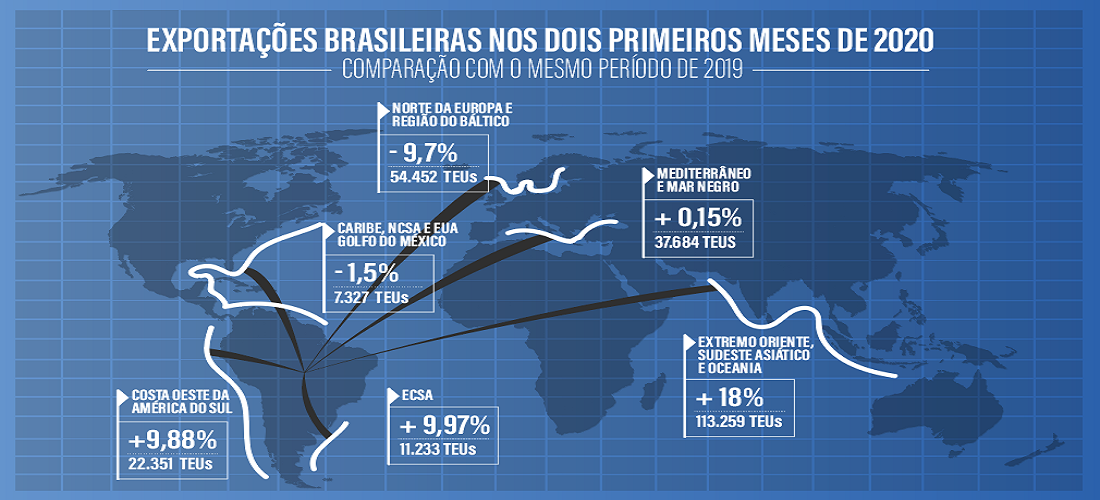
Brazil’s container shipping performance by trade lane for first two months of 2020
Apr, 16, 2020 Posted by datamarnewsWeek 202017
Has the pandemic caused by the coronavirus already had an impact on Brazilian imports and exports according to the main ranges of trade?
Analysis carried out using DataLiner data until February (the last full month of data available in the system) still does not show this impact. If we compare the first two months of 2020 with the first two months of 2019 (by TEU) it is possible to notice that most trade lanes showed growth up to February, although the trend is expected to show another reality going forward.
Trade lanes
In the Mediterranean and Black Sea belt, imports grew 18% in the first two months of 2020 compared to 2019 (Jan and Feb 2019: 26,912 TEU and Jan and Feb 2020: 31,825 TEU). In exports, the growth was 0.15% (Jan and Feb 2019: 37,627 TEU and Jan and Feb 2020: 37,684 TEU).
In the Far East, Southeast Asia and Oceania trade lane, the growth in imports in the first two months of 2020 was 15% over the same period in 2019 (Jan and Feb 2019: 172,261 TEU and Jan and Feb 2020: 199,556 TEU). In exports, the increase was 18% (Jan and Feb 2019: 95,613 TEU and Jan and Feb 2020: 113,259 TEU).
In Northern Europe and the Baltic region, imports increased 11% in the first two months of 2020 compared to the same period in 2019 (Jan and Feb 2019: 69,184 TEU and Jan and Feb 2020: 76,848 TEU). Exports had a fall of 9.17% in the same period (Jan and Feb 2019: 59,949 TEU and Jan and Feb 2020: 54,452 TEU).
In the Southeast Africa, the Middle East and Indian subcontinent trade lane imports dropped 11% in the first two months of 2020 compared to the same period in 2019 (Jan and Feb 2019: 1,764 TEU and Jan and Feb 2020: 1,570 TEU). Exports grew by 0.5% (Jan and Feb 2019: 8,925 TEU and Jan and Feb 2020: 8,972 TEU).
In the West Africa commercial strip, in the first two months of 2020, imports grew 19% (Jan and Feb 2019: 296 TEU and Jan and Feb 2020: 353 TEU). Exports grew 9.7% (Jan and Feb 2019: 11,679 TEU and Jan and Feb 2020: 12,823 TEU).
In the first two months of 2020, in the Caribbean, NCSA and USA / Gulf of Mexico trade lane there was a 20.7% drop in imports (Jan and Feb 2019: 179 TEU and Jan and Feb 2020: 142 TEU and a decrease of 1.5 % in exports in relation to the same period in 2019 (Jan and Feb 2019: 7,444 TEU and Jan and Feb 2020: 7,327 TEU).
In the South America West Coast trade strip, imports fell 0.18% in the first two months of 2020 compared to the same period in 2019 (Jan and Feb 2019: 5,884 TEU and Jan and Feb 2020: 7,055 TEU). Exports increased 9.88% in the same period (Jan and Feb 2019: 21,762 TEU and Jan and Feb 2020: 22,351 TEU).
In ECSA, imports grew 0.96% in the first two months of 2020 compared to the same period in 2019 (Jan and Feb 2019: 9,985 TEU and Jan and Feb 2020: 10,081 TEU). Exports grew 9.97% in the same period (Jan and Feb 2019: 10,214 TEU and Jan and Feb 2020: 11,233 TEU).
In the WCNA / WCCA tradelane, imports fell 0.18% in the first two months of 2020 compared to the same period in 2019 (Jan and Feb 2019: 2,141 TEU and Jan and Feb 2020: 2,137 TEU). Exports grew 9.88% (Jan and Feb 2019: 5,613 TEU and Jan and Feb 2020: 6,168 TEU).
Finally, in the ECNA range, Imports grew 19.6% in the first two months of 2020 compared to the same months of 2019 (Jan and Feb 2019: 21,360 TEU and Jan and Feb 2020: 25,562 TEU). Exports, in the same period, decreased by 6.09% (Jan and Feb 2019: 44,121 TEU and Jan and Feb 2020: 41,432 TEU).
-
Ports and Terminals
Sep, 24, 2021
0
New rainwater system to drain 375,000 m² area at Port of Paranaguá
-
Ports and Terminals
Jun, 05, 2024
0
Modernization of Aratu Port set to boost export capacity
-
Automotive
Aug, 07, 2024
0
Brazilian Auto Exports Decline, but July Shows Promise
-
Grains
May, 05, 2025
0
Argentina April Grain Exports Jump 32% to $2.52 Bln on Tax Cuts, Soy Harvest Start

