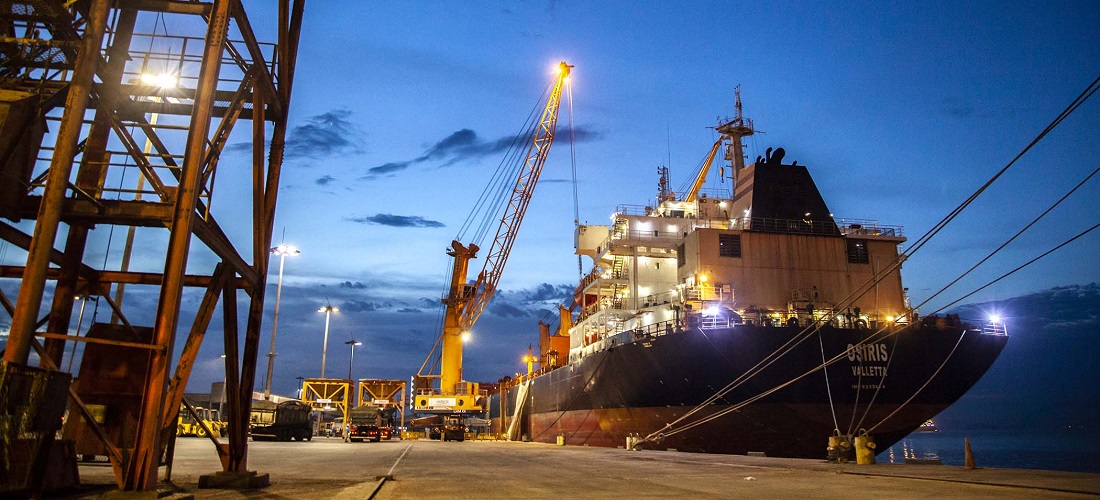
Container vessel calls recover slightly in third quarter
Oct, 01, 2020 Posted by Ruth HollardWeek 202040
Container vessel calls at Brazilian ports and blank sailings are thermometers of the country’s economy and foreign trade. Therefore, the Datamar team carried out a survey of the main changes that these maritime routes have undergone in recent months and what we can expect for the future.
Blank Sailings
During the peak of the Covid-19 pandemic, some blank sailings were recorded on the main international trade routes. But there have been no more blank sailings registered since the second half of August and none are expected until November at the earliest.
The main routes that had blank crossings during the pandemic were the Far East and East Coast of South America, which registered four (three in June and one in July); and the Gulf of Mexico (southern United States) / Caribbean and East Coast South America, which also registered four (three in June and one in August). The West Coast and East Coast of South America (July) and West Africa and East Coast of South America (August) routes had only one blank sailing each forecast during the period from June to November.
Regarding container vessel calls at Brazilian ports, during the 3rd quarter (July, August, and September) there was an increase of 2.16% in relation to the 2nd quarter (April, May, and June). In the first nine months of the year, however, there was a 4% reduction in moorings (5229 in the period from January to September 2019 and 5043 in the same period in 2020).
See the graph below for the monthly history starting in January 2019:
Monthly Container Ship Calls in Brazilian Ports | Jan 2019 to Aug 2020
Source: DataLiner
In relation to ports, the terminals in the Northeast were the ones that presented the greatest variation in the decreased container ship calls. Two ports in the south of the country had a positive result in the same period. See the table below:
Container Ship Calls in Brazilian ports – 9-month period Jan to Aug 2019 vs. 2020
The high growth in the Port of Itaqui is due to the fact that in August 2019 a testing phase began for a regular service that only started in February / 2020.
Source: DataLiner (To request a DataLiner demo click here)
According to the Port Authority of the Port of Vitória (CODESA), the worst is over. The port has shown an improvement in cargo handling since June. In addition, CODESA indicators point to an increase in the volume of goods over the second half of 2020. For the agency, there are already many scheduled operations at the Port of Vitória which indicate that this indicator will remain high.
-
Grains
Jul, 05, 2021
0
Agricultural commodity prices are expected to lose steam in the next decade
-
Ports and Terminals
May, 02, 2024
0
Suape Receives Largest Shipment of Turbines for Wind Farm
-
Meat
Jun, 30, 2022
0
Santa Catarina pork producers keen to export to Canada in hope of milder crisis ahead
-
Grains
Apr, 03, 2019
0
Brazil’s soybean exports may fall by up to 24% if US-China trade war ends

