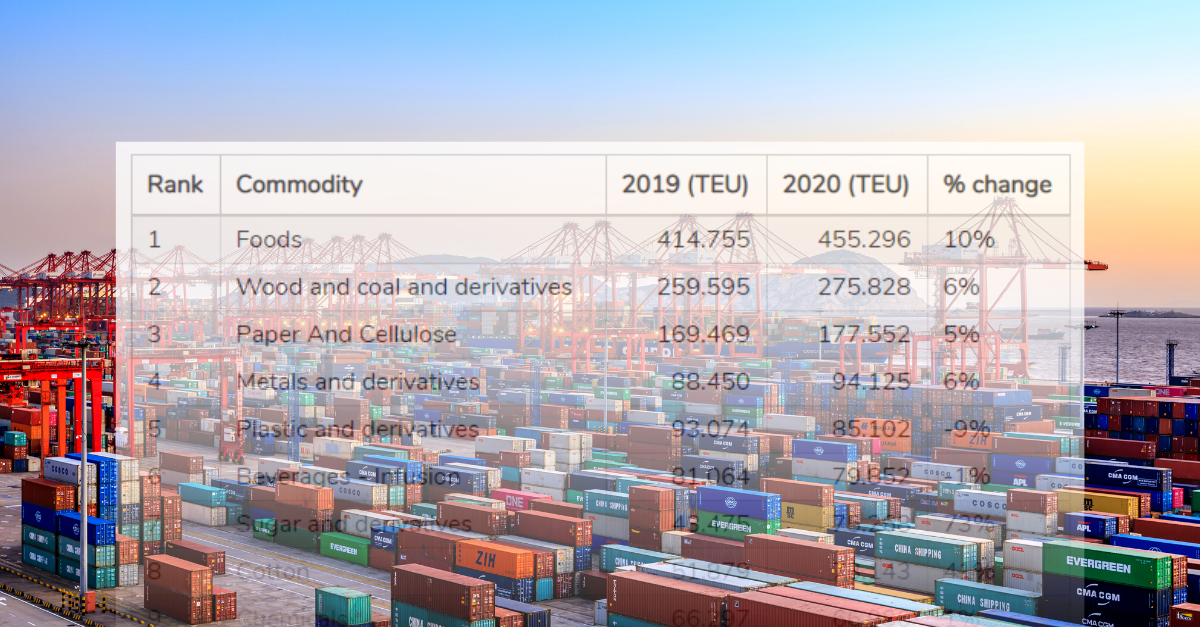
DataLiner ranks Brazil’s container imports and exports for January – August 2020
Oct, 28, 2020 Posted by Ruth HollardWeek 202045
DatamarNews publishes a monthly ranking of Brazil’s main goods imported and exported by container according to DataLiner data. The ranking below covers the period from January to August 2020:
Ranking of most Exported Goods from January to August 2020 | TEU
Among the most exported goods between January and August 2020, the food category leads the ranking, with 455,296 TEU, an increase of 10% YoY. Despite this, the biggest growths are found in goods such as sugar and its derivatives, which grew 73% during the first eight months of the year compared to the same period in 2019, and cotton which showed a 41% growth. The accumulated growth of all goods exported during the period was 5%.
Source: DataLiner
Ranking of most Imported Goods from January to August 2020 | TEU
Among the imported goods, plastics and derivatives lead the rankings. Despite having registered a 6% decrease in the first eight months of 2020 in relation to the same period of 2019, it was still the most imported merchandise, with 170,584 TEU. The positive highlight is fertilizer imports, which grew 29% in the period. In overall accumulated imported goods, there was a 12% drop in imports between January and August 2020 compared to the same period in 2019.
Source: DataLiner
(To request a DataLiner demo click here)
-
Coffee
Dec, 09, 2024
0
Mercosur-EU Trade Agreement: Key Details on Agricultural and Livestock Exports
-
Ports and Terminals
May, 25, 2020
0
Port of Santos breaks throughput records in April
-
Grains
Jun, 01, 2021
0
Brazil assumes world leadership in grain export revenue
-
Oil and Gas
Apr, 08, 2019
0
Engie SA buys 90% of TAG pipeline unit from Petrobras

