DataLiner ranks Brazil’s container imports and exports for January – October 2020
Dec, 14, 2020 Posted by Sylvia SchandertWeek 202051
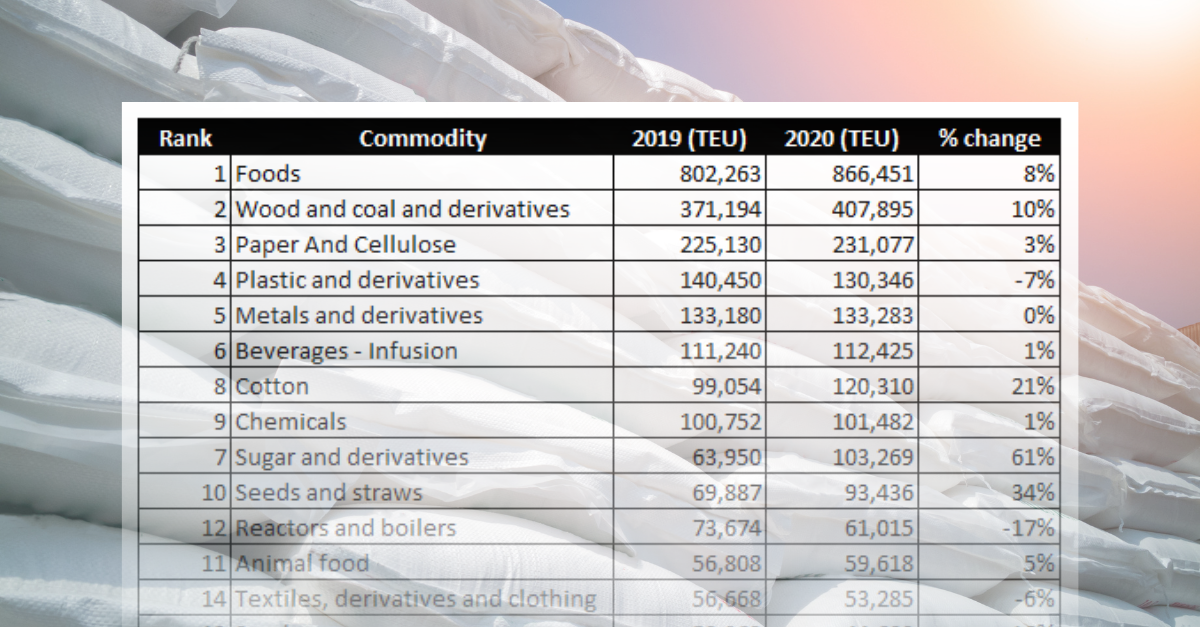
DatamarNews publishes a monthly ranking of Brazil’s main goods imported and exported by container according to DataLiner data. The ranking below covers the period from January to October 2020. The food category continues in the lead as the most exported product category for Brazil in 2020, with a growth of 8% compared to 2019 figures. Close behind are cotton (21%) and sugar and its derivatives (61%).
Ranking of most Exported Goods from January to October 2020 | TEU
Source: DataLiner
Contrary to exports, which showed positive performance in 2020 thanks to a positive exchange rate, imports fell in almost every category. But one sector had a good year- that of fertilizers – which grew 14% to meet the high demand in the agribusiness sector.
Ranking of most Imported Goods from January to August 2020 | TEU
Source: DataLiner
(To request a DataLiner demo click here)
Related Post
-
Economy
Oct, 23, 2024
0
China overtakes Brazil in South America’s export market
-
Ports and Terminals
Jul, 15, 2021
0
Santos liquids sector needs more berths
-
Shipping
Feb, 26, 2024
0
Refueling challenges at Port of Santos drive operators to million-dollar losses
-
Ports and Terminals
Aug, 19, 2024
0
First round of 2024 port lease auctions set for August 21


