DataLiner ranks Brazil’s most imported and exported goods from January to November 2020
Jan, 17, 2021 Posted by Ruth HollardWeek 200102
DatamarNews is periodically publishing a ranking of the main goods imported and exported by containers through Brazil according to DataLiner data. The ranking below covers the period from January to November 2020:
Exports
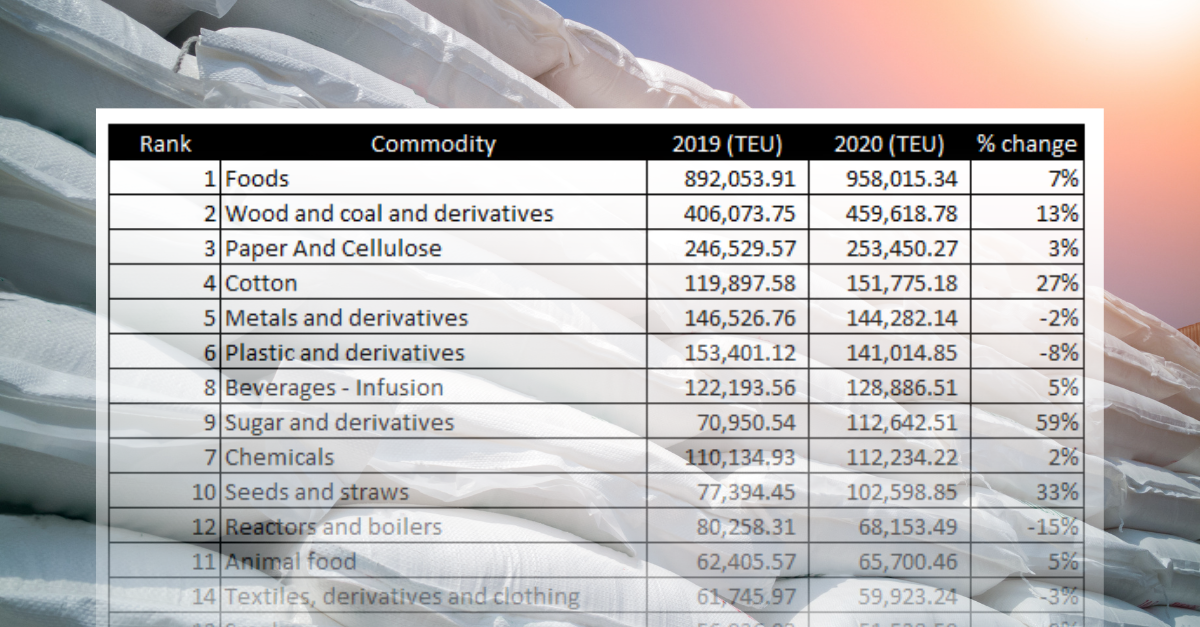
Food continues to lead the list among the most exported commodities in 2020, with a growth of 7% compared to 2019. Other highlights of the period are the increase in exports of cotton (27%) and sugar and derivatives (59%).
Ranking of Brazil’s Most Exported Goods | Jan to Nov 2019-2020 | TEU
wdt_ID | Rank | Commodity | 2019 (TEU) | 2020 (TEU) | % change |
---|---|---|---|---|---|
1 | 1 | Foods | 892.054 | 958.015 | 7% |
2 | 2 | Wood and coal and derivatives | 406.074 | 459.619 | 13% |
3 | 3 | Paper And Cellulose | 246.530 | 253.450 | 3% |
4 | 4 | Cotton | 119.898 | 151.775 | 27% |
5 | 5 | Metals and derivatives | 146.527 | 144.282 | -2% |
6 | 6 | Plastic and derivatives | 153.401 | 141.015 | -8% |
7 | 8 | Beverages - Infusion | 122.194 | 128.887 | 5% |
8 | 9 | Sugar and derivatives | 70.951 | 112.643 | 59% |
9 | 7 | Chemicals | 110.135 | 112.234 | 2% |
10 | 10 | Seeds and straws | 77.394 | 102.599 | 33% |
11 | 12 | Reactors and boilers | 80.258 | 68.153 | -15% |
12 | 11 | Animal food | 62.406 | 65.700 | 5% |
13 | 14 | Textiles, derivatives and clothing | 61.746 | 59.923 | -3% |
14 | 13 | Smoke | 56.936 | 51.538 | -9% |
15 | 15 | Minerals and derivatives | 50.273 | 51.017 | 1% |
16 | Total | 2.656.775 | 2.860.851 | 8% | |
17 | Others | 433.768 | 406.725 | -6% | |
18 | Grand total | 3.090.544 | 3.267.576 | -6% |
Source: DataLiner
Imports
Imports registered an overall drop of 8%. The worst decreases were in the “vehicles and parts” segment, which fell 26%. The positive highlight was fertilizer imports, which grew 15%, motivated by the increased Brazilian agriculture.
Ranking of Brazil’s Most Imported Goods | Jan to Nov 2019-2020 | TEU
wdt_ID | Rank | Commodity | 2019 (TEU) | 2020 (TEU) | % change |
---|---|---|---|---|---|
1 | 1 | Plastic and derivatives | 328.475 | 337.660 | 3% |
2 | 2 | Chemicals | 312.059 | 318.638 | 2% |
3 | 3 | Reactors and boilers | 314.742 | 293.727 | -7% |
4 | 4 | Vehicles and parts | 327.618 | 241.730 | -26% |
5 | 5 | Electric machines | 218.253 | 217.387 | -0% |
6 | 6 | Metals and derivatives | 197.339 | 178.623 | -9% |
7 | 7 | Textiles, derivatives and clothing | 191.242 | 155.489 | -19% |
8 | 8 | Rubber and derivatives | 122.006 | 98.129 | -20% |
9 | 9 | Foods | 109.030 | 108.622 | -0% |
10 | 10 | Paper And Cellulose | 91.776 | 84.112 | -8% |
11 | 11 | Fertilizer | 56.907 | 65.311 | 15% |
12 | 12 | Furniture | 54.313 | 47.168 | -13% |
13 | 13 | Glass and derivatives | 47.526 | 39.444 | -17% |
14 | 14 | Drinks | 43.233 | 39.851 | -8% |
15 | 15 | Salt, plaster, cement | 36.590 | 39.143 | 7% |
16 | Total | 2.451.108 | 2.265.034 | -8% | |
17 | Others | 486.556 | 438.719 | -10% | |
18 | Grand total | 2.937.664 | 2.703.753 | -8% |
Source: DataLiner (To request a DataLiner demo click here)
-
Shipping
Jan, 29, 2024
0
Maersk names first vessel of its methanol-enabled fleet “Ane Maersk”
-
Shipping
Feb, 10, 2021
0
Maersk reports revenue growth in 2020 despite pandemic
-
Grains
Apr, 27, 2021
0
ADM’s net earnings grew 77.2% in the first quarter
-
Economy
Jun, 22, 2023
0
Brazil and UK seek to strengthen bilateral ties in trade and investment