RANKING GOODS
Commodities

DATALINER RANKS MAIN IMPORTS & EXPORTS FOR JAN-JULY 2020

Sep, 14, 2020 Posted by Sylvia Schandert

Week 202037

DatamarNews publishes a monthly ranking of the main goods imported and exported by Brazilian containers according to DataLiner data. The ranking below covers the period from January to July 2020.


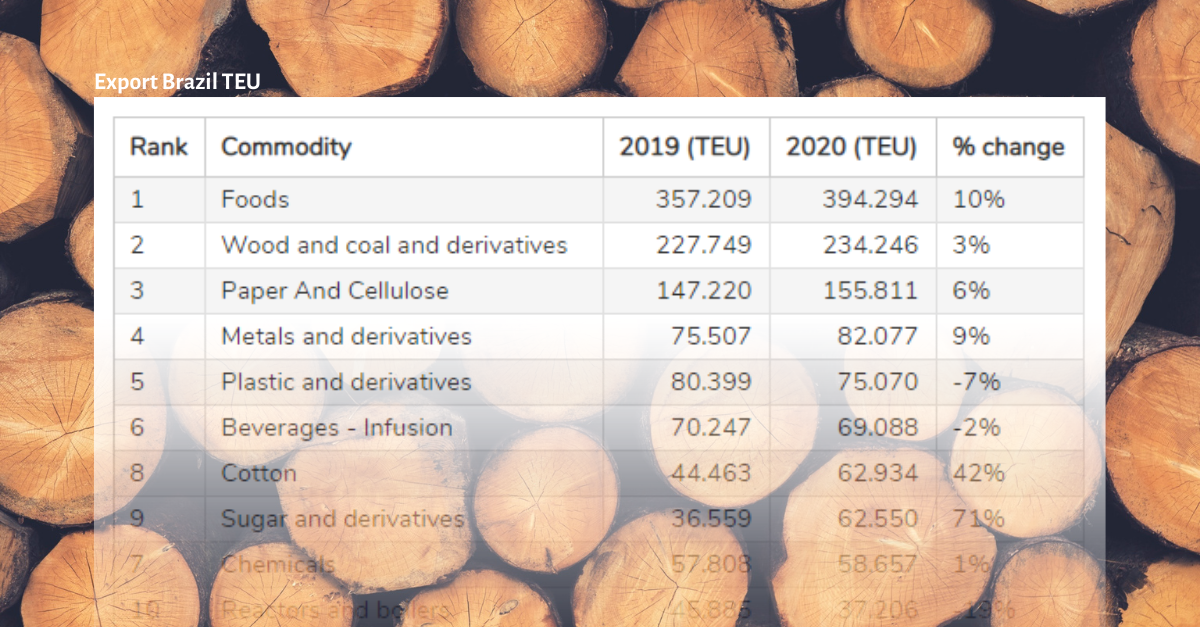
Ranking of the Most Exported Goods in the Period from January to July 2020 | TEU

Food exports remain in first place, with a 10% growth in the first seven months of 2020 as compared to the same period in 2019. Other goods showed very sharp growths, such as sugar and derivatives (71%) and cotton (42%). Exports of ceramics (-19%) and reactors and boilers (-19%) showed the sharpest decreases in the period.


wdt_ID Rank Commodity 2019 (TEU) 2020 (TEU) % change
1 1 Foods 357.209 394.294 10%
2 2 Wood and coal and derivatives 227.749 234.246 3%
3 3 Paper And Cellulose 147.220 155.811 6%
4 4 Metals and derivatives 75.507 82.077 9%
5 5 Plastic and derivatives 80.399 75.070 -7%
6 6 Beverages - Infusion 70.247 69.088 -2%
7 8 Cotton 44.463 62.934 42%
8 9 Sugar and derivatives 36.559 62.550 71%
9 7 Chemicals 57.808 58.657 1%
10 10 Reactors and boilers 45.885 37.206 -19%
11 12 Animal food 27.123 29.204 8%
12 11 Minerals and derivatives 32.384 28.669 -11%
13 14 Textiles, derivatives and clothing 28.237 25.393 -10%
14 13 Smoke 29.234 24.867 -15%
15 15 Ceramics 27.170 21.912 -19%
16 Total 1.287.195 1.361.979 6%
17 Others 211.223 197.839 -6%
18 Grand total 1.498.418 1.559.818 4%

Source: DataLiner


Ranking of the Most Imported Goods in the Period from January to July 2020 | TEU

The most imported products were plastics and their derivatives, which nevertheless registered a 4% drop in the first seven months of 2020 as compared to the same period in 2019. Fertilizer imports grew the most, increasing by 35%. The steepest decline was in imports of vehicles and auto parts (-29%).


wdt_ID Rank Commodity 2019 (TEU) 2020 (TEU) % change
1 1 Plastic and derivatives 157.217 151.057 -4%
2 2 Chemicals 139.726 142.419 2%
3 3 Reactors and boilers 136.213 123.357 -9%
4 4 Vehicles and parts 163.518 116.283 -29%
5 5 Electric machines 100.908 100.860 -0%
6 6 Metals and derivatives 90.894 81.212 -11%
7 7 Textiles, derivatives and clothing 95.011 68.875 -28%
8 8 Foods 53.852 51.908 -4%
9 9 Rubber and derivatives 54.025 41.166 -24%
10 10 Fertilizer 28.620 38.557 35%
11 11 Paper And Cellulose 38.555 37.269 -3%
12 12 Salt, plaster, cement 18.241 19.950 9%
13 13 Glass and derivatives 23.722 18.735 -21%
14 14 Drinks 17.804 16.007 -10%
15 15 Furniture 21.175 15.939 -25%
16 Total 1.139.482 1.023.592 -10%
17 Others 216.938 193.459 -11%
18 Grand total 1.356.420 1.217.051 -10%

Source: DataLiner

(To request a DataLiner demo click here)

Sharing is caring!

Leave a Reply

Your email address will not be published. Required fields are marked *


The reCAPTCHA verification period has expired. Please reload the page.