ECSA merchandise exports up 7%
Jun, 22, 2021 Posted by Ruth HollardWeek 202126
From January to April, exports of goods from countries on the East Coast of South America reached 1,151,038 TEU, growing 7% compared to the same period in 2020. The data are contained in the ranking of goods prepared by the Datamar team based on data from DataLiner. In imports, the growth was much more expressive: 18%, with 1,223,830 TEU.
Exports
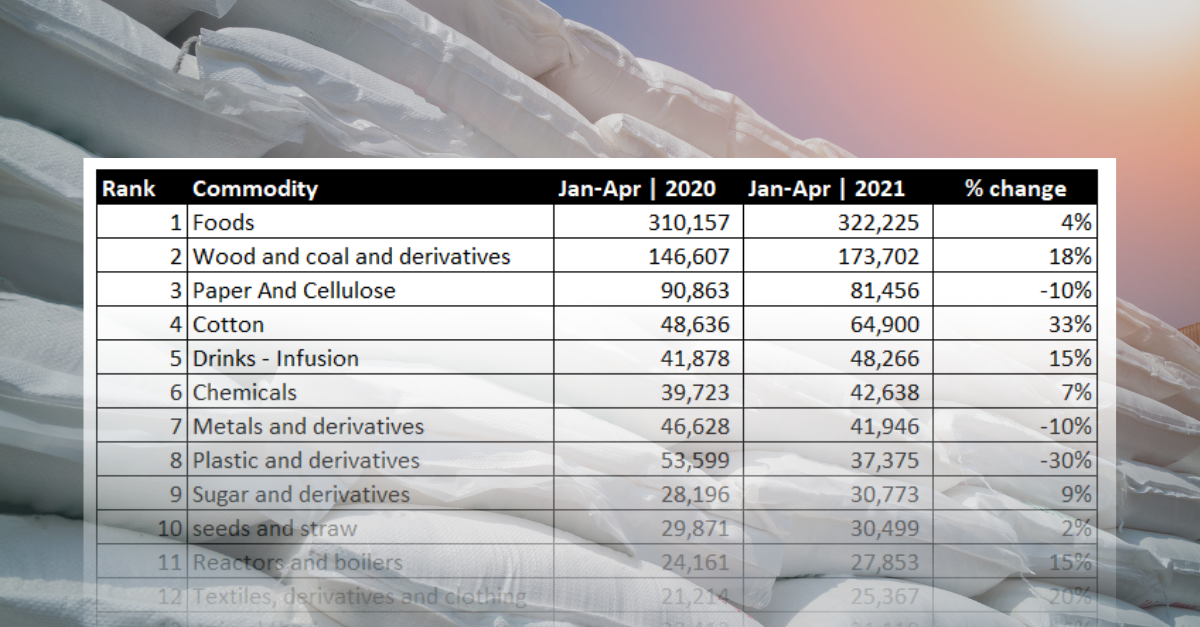
The food category continues to lead the ranking of exports, growing 4% in the first four months of 2021 compared to the same period in 2020. A positive highlight was cotton exports, up 33% in the period. Ceramic exports also performed well, with a growth of 42%. On the other hand, exports of plastics and derivatives dropped 30% in the same comparison.
ECSA container exports | Jan and Apr 2020 / 2021 | TEU
wdt_ID | Rank | Commodity | Jan-Apr | 2020 | Jan-Apr | 2021 | % change |
---|---|---|---|---|---|
1 | 1 | Foods | 310,157 | 322,225 | 4% |
2 | 2 | Wood and coal and derivatives | 146,607 | 173,702 | 18% |
3 | 3 | Paper And Cellulose | 90,863 | 81,456 | -10% |
4 | 4 | Cotton | 48,636 | 64,900 | 33% |
5 | 5 | Drinks - Infusion | 41,878 | 48,266 | 15% |
6 | 6 | Chemicals | 39,723 | 42,638 | 7% |
7 | 7 | Metals and derivatives | 46,628 | 41,946 | -10% |
8 | 8 | Plastic and derivatives | 53,599 | 37,375 | -30% |
9 | 9 | Sugar and derivatives | 28,196 | 30,773 | 9% |
10 | 10 | seeds and straw | 29,871 | 30,499 | 2% |
11 | 11 | Reactors and boilers | 24,161 | 27,853 | 15% |
12 | 12 | Textiles, derivatives and clothing | 21,214 | 25,367 | 20% |
13 | 13 | Animal food | 22,412 | 21,110 | -6% |
14 | 14 | Ceramic | 13,533 | 19,217 | 42% |
15 | 15 | Vehicles and Parts | 14,747 | 18,411 | 25% |
16 | Total | 932,225 | 985,738 | 6% | |
17 | Others | 141,901 | 165,300 | 16% | |
18 | Grand total | 1,074,126 | 1,151,038 | 7% |
Graph source: DataLiner (To request a DataLiner demo click here)
Imports
Plastics and derivatives drove exports, with a 26% growth in volume from January to April 2021 compared to the same months in 2020. The fuel category was the one that proportionally grew the most in the period: 48%. The food category remained stable. The only drop in imports was for fertilizers, dropping 8%.
ECSA container imports | Jan and Apr 2020 / 2021 | TEU
wdt_ID | Rank | Commodity | Jan-Apr | 2020 | Jan-Apr | 2021 | % change |
---|---|---|---|---|---|
1 | 1 | Plastic and derivatives | 128,066 | 161,309 | 26% |
2 | 2 | Reactors and boilers | 107,532 | 139,207 | 29% |
3 | 3 | Vehicles and Parts | 110,571 | 126,662 | 15% |
4 | 4 | Chemicals | 109,142 | 117,554 | 8% |
5 | 5 | Electric machines | 84,914 | 106,685 | 26% |
6 | 6 | Metals and derivatives | 70,017 | 89,622 | 28% |
7 | 7 | Textiles, derivatives and clothing | 69,029 | 76,281 | 11% |
8 | 8 | rubber and derivatives | 40,301 | 50,841 | 26% |
9 | 9 | Foods | 39,521 | 39,672 | 0% |
10 | 10 | Paper And Cellulose | 33,961 | 35,370 | 4% |
11 | 11 | Furniture | 17,422 | 20,693 | 19% |
12 | 12 | Fertilizer | 20,972 | 19,299 | -8% |
13 | 13 | Glass and derivatives | 16,449 | 17,625 | 7% |
14 | 14 | Drinks | 16,898 | 17,036 | 1% |
15 | 15 | Fuels | 11,281 | 16,740 | 48% |
16 | Total | 876,076 | 1,034,596 | 18% | |
17 | Others | 164,471 | 189,234 | 15% | |
18 | Grand total | 1,040,547 | 1,223,830 | 18% |
Graph source: DataLiner (To request a DataLiner demo click here)
-
Ports and Terminals
Aug, 19, 2024
0
Above national average: Port of Mucuripe reveals 13.2% hike in cargo throughput
-
Dec, 06, 2021
0
Production chains in Southeast Asia are better prepared for Covid-19 outbreaks
-
Uncategorized
Jul, 01, 2020
0
Cargo Release Time study shows Brazil’s average to be 7.4 days
-
Ports and Terminals
Feb, 03, 2020
0
Port of Paranaguá operates vehicle carrier in public berths