ECSA merchandise ranking
Aug, 26, 2021 Posted by Ruth HollardWeek 202134
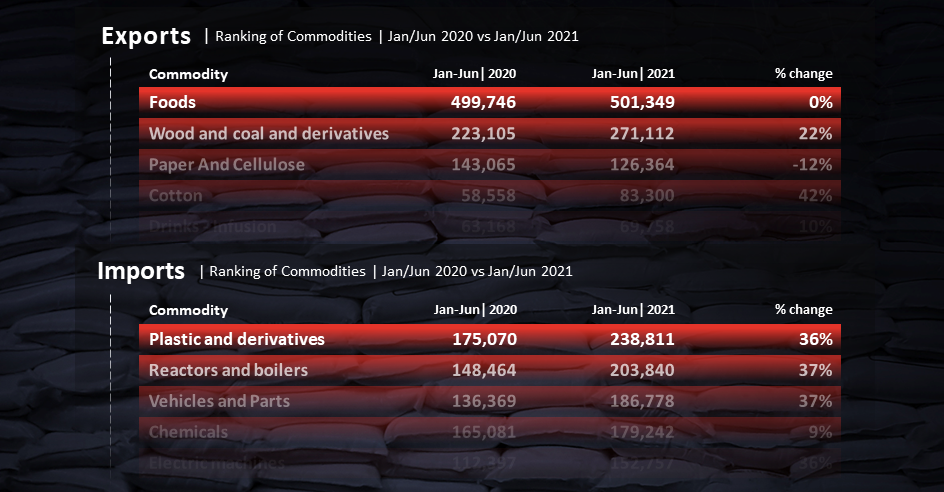
Exports via containers from the East Coast of South America grew 4% in the first half of 2021 compared to the same period in 2020. Imports grew even more, at 28%. See the following tables showing the main products exported and imported in the period, as well as the comparison of each merchandise with the volumes of the first semester of 2020. Data are from DataLiner.
Exports
The Food category leads the ranking of the most exported products on the East Coast of South America in the first half of 2021. Export volumes, however, are practically the same as in the same period in 2020. The positive highlights were cotton (+42% ) and ceramics (+63%). The biggest drop was in the plastics and derivatives category (-28%).
Container exports along the East Coast of South America | Jan to June 2020 / 2021 | TEU
wdt_ID | Rank | Commodity | Jan-Jun | 2020 | Jan-Jun | 2021 | % change |
---|---|---|---|---|---|
1 | 1 | Foods | 499,746 | 501,349 | 0% |
2 | 2 | Wood and coal and derivatives | 223,105 | 271,112 | 22% |
3 | 3 | Paper And Cellulose | 143,065 | 126,364 | -12% |
4 | 4 | Cotton | 58,558 | 83,300 | 42% |
5 | 5 | Drinks - Infusion | 63,168 | 69,758 | 10% |
6 | 6 | Chemicals | 60,437 | 64,603 | 7% |
7 | 8 | Metals and derivatives | 76,877 | 64,462 | -16% |
8 | 9 | Plastic and derivatives | 81,959 | 59,317 | -28% |
9 | 7 | seeds and straw | 51,009 | 47,113 | -8% |
10 | 10 | Sugar and derivatives | 54,309 | 46,894 | -14% |
11 | 12 | Reactors and boilers | 34,942 | 41,963 | 20% |
12 | 11 | Textiles, Derivatives and Clothing | 29,522 | 36,411 | 23% |
13 | 14 | Animal food | 35,611 | 33,585 | -6% |
14 | 13 | Ceramic | 18,204 | 29,692 | 63% |
15 | 15 | Minerals and derivatives | 23,724 | 28,965 | 22% |
16 | Total | 1,454,236 | 1,504,888 | 3% | |
17 | Others | 309,758 | 336,106 | 9% | |
18 | Grand total | 1,763,994 | 1,840,994 | 4% |
Source: DataLiner (To request a DataLiner demo click here)
Imports
In imports, on the other hand, the leader in the ranking are plastics and derivatives, which grew 36%. The biggest growth in percentages was in the fuel category (+69%) and the only drop was in the import of fertilizers (-10%).
Container imports along the East Coast of South America | Jan to Jun 2020 / 2021 | TEU
wdt_ID | Rank | Commodity | Jan-Jun | 2020 | Jan-Jun | 2021 | % change |
---|---|---|---|---|---|
1 | 1 | Plastic and derivatives | 175,070 | 238,811 | 36% |
2 | 2 | Reactors and boilers | 148,464 | 203,840 | 37% |
3 | 3 | Vehicles and Parts | 136,369 | 186,778 | 37% |
4 | 4 | Chemicals | 165,081 | 179,242 | 9% |
5 | 5 | Electric machines | 112,397 | 152,757 | 36% |
6 | 6 | Metals and derivatives | 96,168 | 133,408 | 39% |
7 | 7 | Textiles, Derivatives and Clothing | 83,151 | 104,946 | 26% |
8 | 8 | rubber and derivatives | 52,175 | 75,876 | 45% |
9 | 9 | Paper And Cellulose | 47,177 | 55,741 | 18% |
10 | 10 | Foods | 53,255 | 54,044 | 1% |
11 | 11 | Fertilizer | 34,446 | 30,997 | -10% |
12 | 12 | Furniture | 22,338 | 29,263 | 31% |
13 | 13 | Glass and derivatives | 19,953 | 25,552 | 28% |
14 | 14 | Fuels | 14,651 | 24,783 | 69% |
15 | 15 | Drinks | 22,535 | 24,322 | 8% |
16 | Total | 1,183,230 | 1,520,360 | 28% | |
17 | Others | 226,314 | 282,674 | 25% | |
18 | Grand total | 1,409,544 | 1,803,034 | 28% |
-
Other Cargo
Jun, 03, 2024
0
Ukraine war boosts asbestos exports from Brazil
-
Grains
Nov, 09, 2022
0
Russia links extension of Black Sea deal to freeing its grain and fertiliser exports
-
Ports and Terminals
Sep, 11, 2019
0
Codesp suggests tunnel to link Santos to Guarujá
-
Meat
Mar, 22, 2022
0
JBS: exports to Russia are interrupted by ‘logistical issues’