Brazil and Plate port ranking for January-May 2019 & 2020
Jul, 03, 2020 Posted by datamarnewsWeek 202027
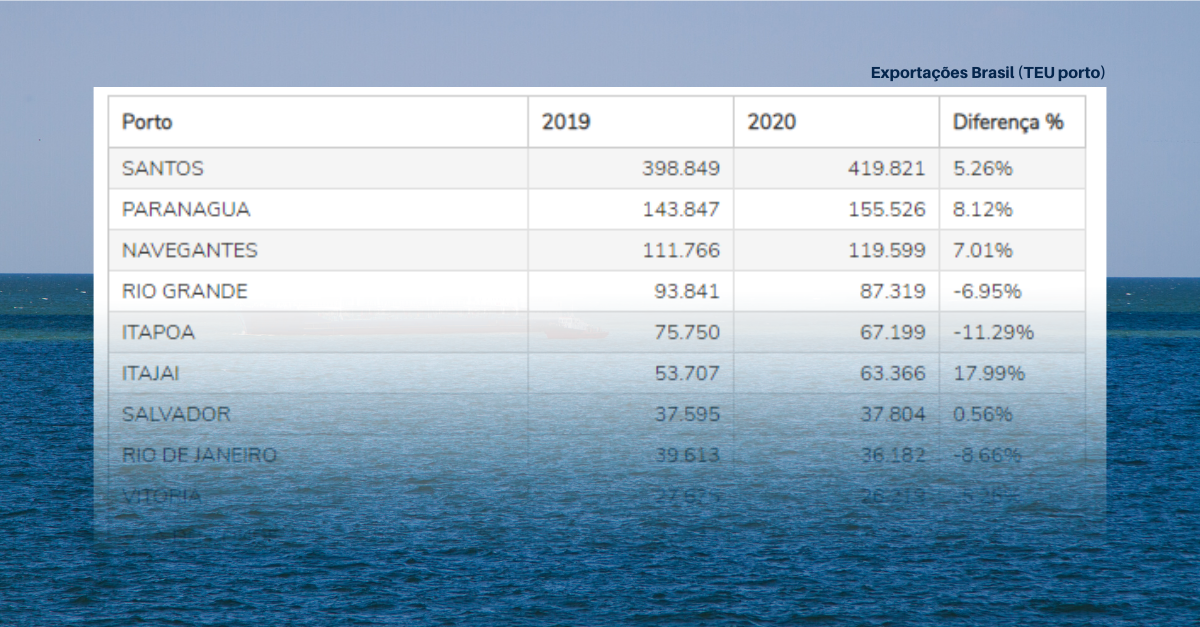
DataLiner data shows that the performance of Brazilian ports and other ports on the East Coast of South America varied considerably in the first five months of 2020. In Brazil, the Port of Santos, which occupies the first place on the list, saw its exports grow 5.26% year-on-year to 419,821 TEU. Another highlight is the Port of Pecém, which had a 47% increase in volume exported over the same period comparison, to 9,579 TEU. On the other hand, the Port of Imbituba saw a 69.25% drop in exports, with 250 TEU shipped during the period.
Brazil Port Ranking – Exports during Jan-May for 2019 and 2020
Exportações Brasil (TEU por porto)
wdt_ID | Ports | 2019 | 2020 | diff% (between 2019 and 2020) |
---|---|---|---|---|
1 | SANTOS | 398.849 | 419.821 | 5.26% |
2 | PARANAGUA | 143.847 | 155.526 | 8.12% |
3 | NAVEGANTES | 111.766 | 119.599 | 7.01% |
4 | RIO GRANDE | 93.841 | 87.319 | -6.95% |
5 | ITAPOA | 75.750 | 67.199 | -11.29% |
6 | ITAJAI | 53.707 | 63.366 | 17.99% |
7 | SALVADOR | 37.595 | 37.804 | 0.56% |
8 | RIO DE JANEIRO | 39.613 | 36.182 | -8.66% |
9 | VITORIA | 27.675 | 26.219 | -5.26% |
10 | VILA DO CONDE | 22.434 | 19.681 | -12.27% |
11 | PORTO DE ITAGUAI | 14.251 | 10.415 | -26.92% |
12 | PECEM | 6.517 | 9.579 | 46.98% |
13 | SUAPE | 8.344 | 9.490 | 13.73% |
14 | FORTALEZA | 8.818 | 8.125 | -7.86% |
15 | NATAL | 7.072 | 7.421 | 4.93% |
16 | MANAUS | 7.083 | 5.818 | -17.86% |
17 | IMBITUBA | 813 | 250 | -69.25% |
Source: DataLiner
Looking at imports, while the volume received by the Port of Santos fell 4.47%, to 367,950 TEU, Itajaí`s intake jumped up by 53.51% compared to year-ago levels, reaching 60,489 TEU.
Brazil Port Ranking – Imports during Jan-May for 2019 and 2020
Importações Brasil (TEU por porto)
wdt_ID | Ports | 2019 | 2020 | diff% (between 2019 and 2020) |
---|---|---|---|---|
1 | SANTOS | 385.185 | 367.950 | -4.47% |
2 | PARANAGUA | 95.009 | 100.111 | 5.37% |
3 | NAVEGANTES | 92.812 | 85.541 | -7.83% |
4 | ITAPOA | 68.942 | 72.848 | 5.67% |
5 | MANAUS | 64.572 | 70.029 | 8.45% |
6 | ITAJAI | 39.404 | 60.489 | 53.51% |
7 | RIO DE JANEIRO | 52.930 | 47.790 | -9.71% |
8 | SUAPE | 32.099 | 33.031 | 2.90% |
9 | RIO GRANDE | 30.966 | 29.977 | -3.19% |
10 | SALVADOR | 25.435 | 28.119 | 10.55% |
11 | VITORIA | 24.027 | 22.241 | -7.44% |
12 | PECEM | 10.696 | 13.881 | 29.78% |
13 | PORTO DE ITAGUAI | 15.244 | 10.103 | -33.72% |
14 | VILA DO CONDE | 2.984 | 3.446 | 15.48% |
15 | FORTALEZA | 778 | 632 | -18.77% |
16 | IMBITUBA | 724 | 281 | -61.19% |
17 | NATAL | 255 | 233 | -8.43% |
18 | PORTO ALEGRE | 128 | 131 | 2.34% |
19 | RECIFE | 59 | 120 | 103.39% |
Source: DataLiner
Looking at Plate data, the Port of Buenos Aires, which occupies the first place in the ranking for exports, grew 8.19% during the first five months of 2020 year-on-year to 161,331 TEU. Another positive highlight is the Port of La Plata, with a performance 64.97% higher, with 551 TEU exported. Going in the other direction was the Port of Bahia Blanca, which saw a 40.62% drop during the same period comparison.
Plate Port Ranking – Exports during Jan-May for 2019 and 2020
Exportações Plate (TEU por porto)
wdt_ID | Ports | 2019 | 2020 | diff% (between 2019 and 2020) |
---|---|---|---|---|
1 | BUENOS AIRES | 149.123 | 161.331 | 8.19% |
2 | MONTEVIDEO | 76.815 | 79.125 | 3.01% |
3 | ZARATE | 11.422 | 12.591 | 10.23% |
4 | SAN ANTONIO ESTE | 10.404 | 12.502 | 20.17% |
5 | ROSARIO | 6.866 | 8.354 | 21.67% |
6 | BAHIA BLANCA | 7.502 | 4.455 | -40.62% |
7 | PUERTO MADRYN | 3.975 | 2.831 | -28.77% |
8 | LA PLATA | 334 | 551 | 64.97% |
9 | MAR DEL PLATA | 430 | 100.00% | |
10 | PUERTO DESEADO | 252 | 298 | 18.25% |
Source: DataLiner
In terms of imports, the Port of Buenos Aires had a modest drop of 0.65% between January-May 2020, with 204,307 TEU received. The worst performing port was Bahía Blanca, which saw an 89.54% drop to 70 TEU.
Plate Port Ranking – Imports during Jan-May for 2019 and 2020
Importações Plate (TEU por porto)
wdt_ID | Ports | 2019 | 2020 | diff% (between 2019 and 2020) |
---|---|---|---|---|
1 | BUENOS AIRES | 206.246 | 204.907 | -0.65% |
2 | MONTEVIDEO | 62.895 | 58.355 | -7.22% |
3 | ZARATE | 19.219 | 18.016 | -6.26% |
4 | ROSARIO | 7.885 | 8.220 | 4.25% |
5 | USHUAIA | 4.932 | 7.241 | 46.82% |
6 | PUERTO MADRYN | 1.112 | 1.124 | 1.08% |
7 | PUERTO DESEADO | 397 | 207 | -47.86% |
8 | BAHIA BLANCA | 669 | 70 | -89.54% |
9 | MAR DEL PLATA | 138 | 39 | -71.74% |
10 | LAS PALMAS +AR | 1.041 | 17 | -98.37% |
11 | SANTA FE | 9 | 16 | 77.78% |
Source: DataLiner
-
Other Cargo
Oct, 31, 2021
0
Suzano approves new plant and exceeds 3Q forecast
-
Blog News (ENG)
Nov, 21, 2022
0
Citrus: Brazil ups juice shipments to US by 60% at the 22/23 season onset
-
Ports and Terminals
Jan, 01, 2021
0
Port of Itajaí approved to receive ISO 14001 certification
-
Ports and Terminals
Jan, 24, 2023
0
Sao Luis Port Terminal breaks cargo throughput record in 2022