Ranking of Ports | DataLiner | Jan-Jul 2022 vs. Jan-Jul 2021 | Brazil and Plate
Sep, 14, 2022 Posted by Gabriel MalheirosWeek 202237
Check below the ranking of Brazilian and Plate ports that exported and imported the most containers in the first seven months of 2022 vis-a-vis the same period in 2021. The data are from DataLiner:
Brazil
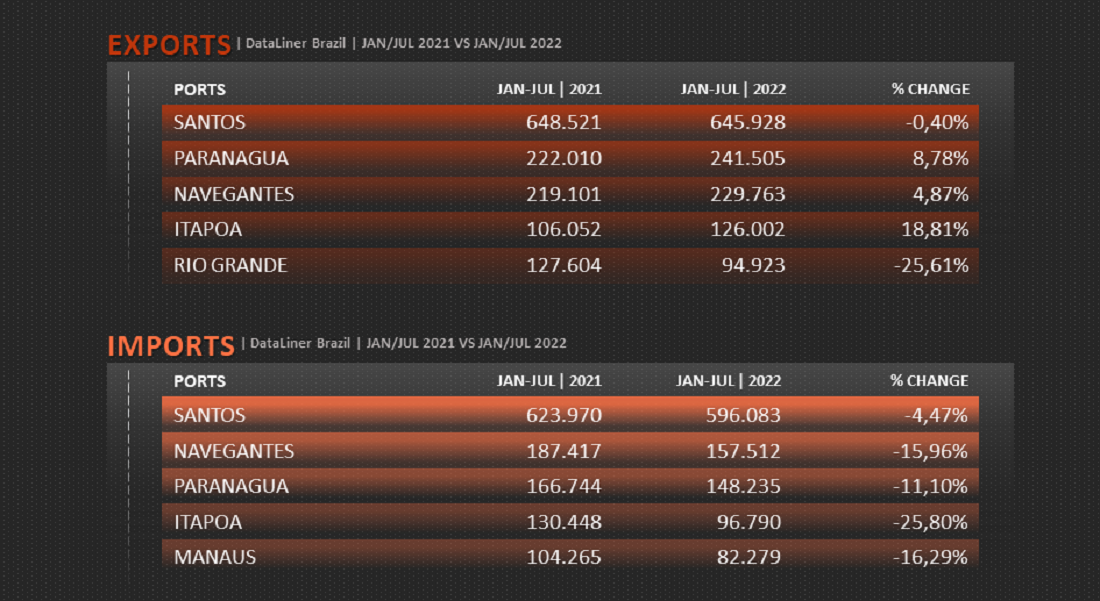
The Port of Santos leads the ranking of exports via containers from January to July 2022, with 645,928 TEUs, a volume in line with the same period in 2021. The Port of Paranaguá occupies the second place, with a volume of 8.78% higher. Navegantes grew 4.87% in the same period. See more below:
Ranking of Brazilian Ports | Exports | Jan/Jul 2021 vs. Jan/Jul 2022 | TEU
wdt_ID | Rank | Ports | Jan-Jul | 2021 | Jan-Jul | 2022 | % Change |
---|---|---|---|---|---|
1 | 1 | SANTOS | 648.521 | 645.928 | -0.40% |
2 | 2 | PARANAGUA | 222.010 | 241.505 | 8.78% |
3 | 3 | NAVEGANTES | 219.101 | 229.763 | 4.87% |
4 | 4 | ITAPOA | 106.052 | 126.002 | 18.81% |
5 | 5 | RIO GRANDE | 127.604 | 94.923 | -25.61% |
6 | 6 | ITAJAI | 85.760 | 52.453 | -38.84% |
7 | 7 | RIO DE JANEIRO | 49.947 | 51.194 | 2.50% |
8 | 8 | SALVADOR | 46.591 | 41.864 | -10.15% |
9 | 9 | VITORIA | 39.570 | 31.068 | -21.49% |
10 | 10 | VILA DO CONDE | 34.444 | 30.641 | -11.04% |
11 | 11 | PECEM | 16.719 | 15.449 | -7.60% |
12 | 12 | FORTALEZA | 16.308 | 13.121 | -19.54% |
13 | 13 | SUAPE | 16.599 | 13.074 | -21.24% |
14 | 14 | MANAUS | 10.415 | 9.539 | -8.41% |
15 | 15 | NATAL | 9.025 | 9.425 | 4.43% |
16 | 16 | ITAGUAI | 14.688 | 9.020 | -38.59% |
17 | OTHERS | 525 | 388 | -26.10% | |
18 | TOTAL | 1.663.880 | 1.615.359 | -2.92% |
Source: DataLiner (click here to request a demo)
In terms of imports, the Port of Santos, which leads the ranking, saw a total volume 4.47% lower than in the first seven months of 2021. The volume at the Port of Navegantes fell by 15.96% and at Paranaguá by 11.1%. See the full table below:
Ranking of Brazilian Ports | Imports | Jan/Jul 2021 vs. Jan/Jul 2022 | TEU
wdt_ID | Rank | Ports | Jan-Jul | 2021 | Jan-Jul | 2022 | % Change |
---|---|---|---|---|---|
1 | 1 | SANTOS | 623.970 | 596.083 | -4.47% |
2 | 2 | NAVEGANTES | 187.417 | 157.512 | -15.96% |
3 | 3 | PARANAGUA | 166.744 | 148.235 | -11.10% |
4 | 4 | ITAPOA | 130.448 | 96.790 | -25.80% |
5 | 5 | MANAUS | 104.265 | 87.279 | -16.29% |
6 | 6 | ITAJAI | 96.373 | 74.898 | -22.28% |
7 | 7 | RIO DE JANEIRO | 72.263 | 67.815 | -6.15% |
8 | 8 | SUAPE | 53.384 | 45.522 | -14.73% |
9 | 9 | SALVADOR | 45.366 | 37.265 | -17.86% |
10 | 10 | VITORIA | 34.108 | 30.520 | -10.52% |
11 | 11 | RIO GRANDE | 42.782 | 28.468 | -33.46% |
12 | 12 | PECEM | 19.206 | 18.627 | -3.01% |
13 | 13 | ITAGUAI | 11.596 | 4.523 | -61.00% |
14 | 14 | VILA DO CONDE | 4.009 | 3.372 | -15.89% |
15 | 15 | FORTALEZA | 1.214 | 695 | -42.75% |
16 | 16 | NATAL | 221 | 180 | -18.55% |
17 | OTHERS | 329 | 168 | -48.94% | |
18 | TOTAL | 1.593.695 | 1.397.952 | -12.28% |
Source: DataLiner (click here to request a demo)
Plate
In the Plate region, the port that led in container exports in the first seven months was Buenos Aires, with a volume 4.34% lower than in 2021. On the other hand, the Port of Montevideo grew 11.07% in the same timeframe.
Ranking of Ports in the Plate region | Exports | Jan/Jul 2021 vs. Jan/Jul 2022 | TEU
wdt_ID | Rank | Ports | Jan-Jul | 2021 | Jan-Jul | 2022 | % Change |
---|---|---|---|---|---|
1 | 1 | BUENOS AIRES | 224.957 | 215.206 | -4.34% |
2 | 2 | MONTEVIDEO | 127.857 | 142.010 | 11.07% |
3 | 3 | ZARATE | 19.458 | 19.372 | -0.44% |
4 | 4 | ROSARIO | 9.088 | 6.293 | -30.75% |
5 | 5 | SAN ANTONIO ESTE | 12.748 | 4.719 | -62.98% |
6 | 6 | LA PLATA | 1.204 | 1.879 | 56.06% |
7 | 7 | MAR DEL PLATA | 0 | 336 | 100.00% |
8 | 8 | PUERTO DESEADO | 0 | 122 | 100.00% |
9 | 9 | PUERTO MADRYN | 3.779 | 0 | -100.00% |
10 | 10 | BAHIA BLANCA | 3.608 | 0 | -100.00% |
11 | TOTAL | 402.700 | 389.936 | -3.17% |
Source: DataLiner (click here to request a demo)
Regarding imports, the volume throughput at the Port of Buenos Aires from January to July 2022 had little difference from the same period in 2021. The second place, the Port of Montevideo, grew 7.4% in the same period. See more below:
Ranking of Ports in the Plate region | Imports | Jan/Jul 2021 vs. Jan/Jul 2022 | TEU
wdt_ID | Rank | Ports | Jan-Jul | 2021 | Jan-Jul | 2022 | % Change |
---|---|---|---|---|---|
1 | 1 | BUENOS AIRES | 323.710 | 323.730 | 0.01% |
2 | 2 | MONTEVIDEO | 110.497 | 118.675 | 7.40% |
3 | 3 | ZARATE | 29.139 | 29.766 | 2.15% |
4 | 4 | ROSARIO | 14.951 | 17.358 | 16.10% |
5 | 5 | USHUAIA | 10.193 | 6.439 | -36.83% |
6 | 6 | VILLETA | 5.667 | 3.723 | -34.30% |
7 | 7 | PUERTO MADRYN | 1.134 | 940 | -17.11% |
8 | 8 | PUERTO DESEADO | 267 | 195 | -26.97% |
9 | 9 | SANTA FE | 48 | 102 | 112.50% |
10 | 10 | BAHIA BLANCA | 148 | 59 | -60.14% |
11 | OTHERS | 283 | 121 | -57.24% | |
12 | TOTAL | 496.036 | 501.108 | 1.02% |
-
Meat
Apr, 28, 2023
0
China clears beef imports produced before “mad cow” case
-
Sugar and Ethanol
Oct, 06, 2021
0
Crop failure in Brazil increases India’s role in the sugar trade
-
Ports and Terminals
Dec, 21, 2021
0
Workers protest against privatization of the Port of Santos and changes in legislation
-
Other Cargo
Aug, 02, 2024
0
Brazil Beer Exports Surge 42% in First Half of 2024