Port Ranking | DataLiner | Jan-Jun 2022 vs. Jan-Jun 2021 | Brazil and Plate
Aug, 19, 2022 Posted by Gabriel MalheirosWeek 202233
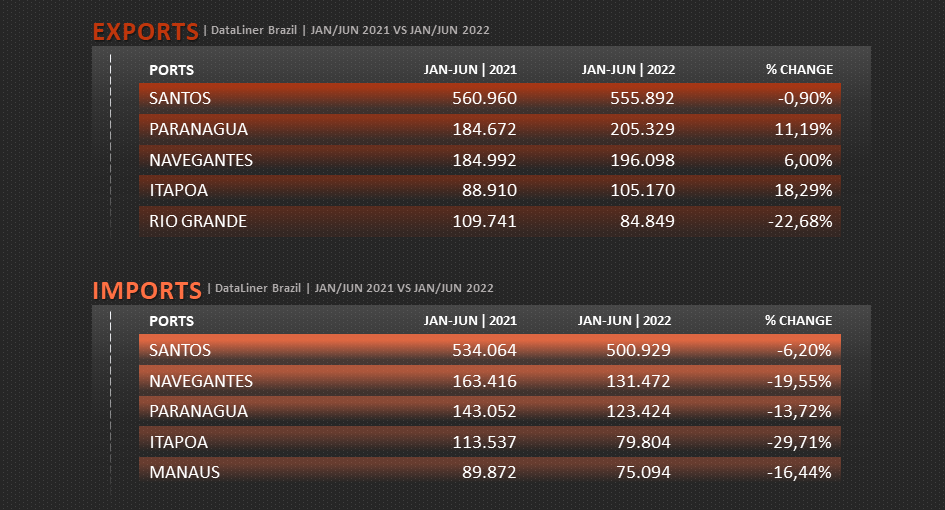
See below the ports ranking in Brazil and the Plate region in terms of exports and imports of containers in the first half of 2022 versus the same period in 2021. The data are from DataLiner.
Brazil
The Port of Santos was the one with the most exports of containers in the first half of 2022, with 555,892 TEUs, a volume in line with exports in the same period of 2021. The second place in the ranking, Paranaguá, exported a volume 11.19 % higher in comparison. See more of it below:
Brazilian Ports Ranking | Exports | Jan/Jun 2021 vs. Jan/Jun 2022 | TEU
Source: DataLiner (click here to request a demo)
Santos also maintained the leadership in container imports, with 500,929 TEUs, a drop of 6.2% compared to the first half of 2021. Navegantes, second in the ranking, dropped 19.55% in the same comparison. More information is available below:
Brazilian Ports Ranking | Imports | Jan/Jun 2021 vs. Jan/Jun 2022 | TEU
Source: DataLiner (click here to request a demo)
Plate
In the Plate region (Paraguay, Uruguay, and Argentina), while the first in the ranking, the Port of Buenos Aires, exported a volume, measured in TEUs, 5.09% lower in the first half of 2022 compared to the same period in 2021. On the other hand, the second-placed port, Montevideo, grew 15.92% in the same comparison. See more below:
Ranking of Ports in the Plate region | Exports | Jan/Jun 2021 vs. Jan/Jun 2022 | TEU
Source: DataLiner (click here to request a demo)
As for imports among the ranking of ports from the Plate region, the Port of Buenos Aires had an imported container throughput of 270,859 TEUs in the first half of 2022, a decrease of 3.54% compared to the same period in 2021. On the other hand, the Port of Montevideo imported a volume 8.56% higher in the same period. Check it out below:
Ranking of Ports in the Plate region | Imports | Jan/Jun 2021 vs. Jan/Jun 2022 | TEU
-
Other Cargo
Feb, 03, 2022
0
Russian blockade may cause nitrate shortages in Brazil
-
Sugar and Ethanol
Aug, 30, 2019
0
Indian sugar export subsidies
-
Ports and Terminals
Dec, 13, 2024
0
TCP Expands Gate Operations to Include Extended Sunday Hours
-
Shipping
Jul, 01, 2024
0
New fuel restrictions for ships in Arctic fall short, green groups say

