Port Ranking for Brazil and Plate – January to August 2020/2021
Oct, 22, 2021 Posted by Ruth HollardWeek 202140
See below the ranking of the ports in Brazil and Plate that most exported and imported containers in the first eight months of 2021 and their comparison with the same period in 2020. Data are from DataLiner:
Brazil
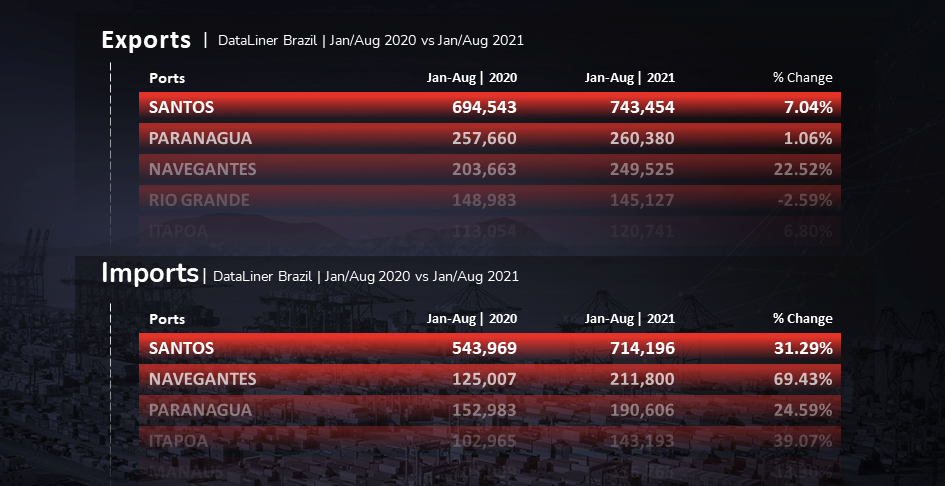
In exports, the Port of Santos continues to lead, with a growth of 7.04% in TEU compared to the same period in 2020. In the second place, Paranaguá had practically the same movement in the annual comparison, growing 1.06%. In third place in the ranking, Navegantes registered a considerable growth of 22.52% in relation to the first eight months of 2020. Proportionally, the strongest growth was in the Port of Fortaleza: 57.5%, with 17,898 TEU.
The biggest drop in exports via containers was registered by the Port of Salvador: -14.64% compared to the first eight months of 2020.
Ranking of Brazilian Ports| Exports | Jan/Aug 2021 vs Jan/Aug 2020 | TEU
Source: DataLiner (click here to request a demo)
In imports, the growth of Santos handling was much more considerable: 31.29% in the first eight months of 2021 compared to the same period in 2020, with 714,196 TEU. The Port of Navegantes ranks second among container importers, with 211,800 TEU, an increase of 69.43% in the same comparison. Paranaguá occupies the third position, with a growth of 24.59%. Like in exports, the Port of Fortaleza registered the greatest growth in imports via containers: 59.19%, with 1,369 TEU.
The biggest drop in imports via containers was registered by the Port of Salvador: 14.64%, with 53,233 TEU.
Ranking of Brazilian Ports| Imports | Jan/Aug 2021 vs Jan/Aug 2020 | TEU
Source: DataLiner (click here to request a demo)
Plate
The ports of the other Plate countries mostly saw a drop in exports. Buenos Aires, with the highest volume, handled 261,303 TEU between January and August 2021, a drop of 6.06% compared to the same period in 2020. The Port of Rosário, affected by the drop in the volume of the Paraná River, registered a drop of 16.86 % on exported volumes.
Ranking of the Plate Region Ports | Exports | Jan/Aug 2021 vs Jan/Aug 2020 | TEU
Source: DataLiner (click here to request a demo)
In imports, most ports in the Plate region experienced positive performance in the January-August 2021 comparison with January-August 2020. The Port of Buenos Aires handled 363,386 TEU in the period, an increase of 19.43% year-on-year. The Port of Montevideo, second in the ranking, grew 32.97%.
Ranking of the Plate Region Ports | Imports | Jan/Aug 2021 vs Jan/Aug 2020 | TEU
-
Other Logistics
Aug, 31, 2021
0
Railway legal framework enables authorization regime to reduce incertainities for private investors
-
Apr, 20, 2023
0
Brazilian police investigate nature of naphtha leak in Paranagua
-
Trade Regulations
May, 21, 2024
0
Brazilian Gov’t launches manual on Rules of Origin for imports
-
Other Cargo
Jun, 06, 2022
0
Brazil’s fertilizer imports are up 16.5%, says Cargonave

