Ports Ranking | DataLiner | Jan 2023 vs. Jan 2022 | Brazil and Plate
Mar, 22, 2023 Posted by Sylvia SchandertWeek 202315
See below the ranking of ports in Brazil and the Plate region regarding container exports and imports in January 2023 compared to the same month last year. The data is from DataLiner, Datamar’s business intelligence tool:
Brazil
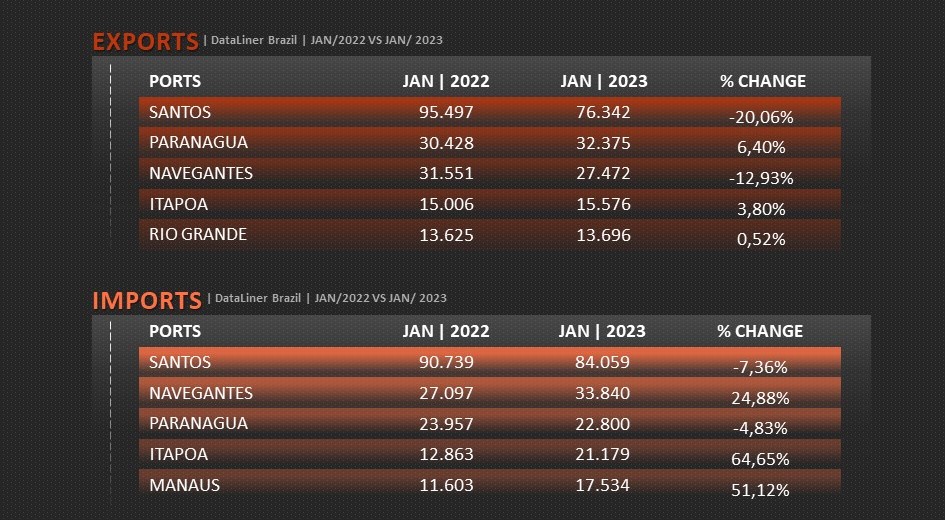
The Port of Santos leads the ranking of containerized exports in Brazil with 76,342 TEUs exported in January, a drop of 20.06% compared to January 2022. The Port of Paranaguá, the runner-up in the ranking, increased exports via containers by 6.40%. See the full ranking below:
Ranking of Brazilian Ports | Exports | Jan 2021 vs. Jan 2022 | TEU
Source: DataLiner (click here to request a demo)
Regarding imports via containers, the leadership in January also belongs to the Port of Santos, with 84,059 TEUs, a drop of 7.36% compared to January 2022. On the other hand, the Port of Navegantes, second in the ranking, imported a volume 24 .88% higher year-on-year. See below the participation of each port:
Ranking of Brazilian Ports | Imports | Jan 2021 vs. Jan 2022 | TEU
Source: DataLiner (click here to request a demo)
Plate (Paraguay, Uruguay, and Argentina)
In the Plate region (Paraguay, Uruguay, and Argentina), the Port of Buenos Aires led exports in January, with 26,394 TEUs, a volume 11.64% lower than January 2022. The Port of Montevideo, second in the ranking, exported a 14.74% lower volume in the same period. See more information below:
Ranking of Ports in the Plate region | Exports | Jan 2021 vs. Jan 2022 | TEU
Source: DataLiner (click here to request a demo)
As for imports, the Port of Buenos Aires handled 35,949 TEUs, a drop of 30.84% compared to January 2022. On the other hand, the Port of Montevideo, second in the ranking, imported a volume 7.54% higher year-on-year. See below:
Ranking of Ports in the Plate region | Imports | Jan 2021 vs. Jan 2022 | TEU
-
Other Cargo
Aug, 04, 2022
0
Agriculture leads exports to USD 1 trillion over the past 10 years in Brazil
-
Other Logistics
May, 23, 2024
0
Maersk launches air freight gateway in Miami to serve U.S., Asia, and Latin America market
-
Meat
Jun, 02, 2021
0
Cyberattack “blinds” the US meat industry
-
Other Cargo
Dec, 02, 2022
0
Oblivious to price drops, Brazil’s 2023 fertilizer purchases remain timid

