Ports Ranking | DataLiner | Jan-Mar 2022 vs. Jan-Mar 2023 | Brazil and Plate
May, 05, 2023 Posted by Gabriel MalheirosWeek 202321
See below the recently unveiled ranking of ports in Brazil and the Plate region (which encompasses Argentina, Uruguay, and Paraguay) in terms of containerized cargo handling during the first quarter of 2023 in comparison to the same period of the previous year. The data used to formulate the rankings below were gathered using DataLiner, Datamar’s cutting-edge business intelligence platform.
Brazil
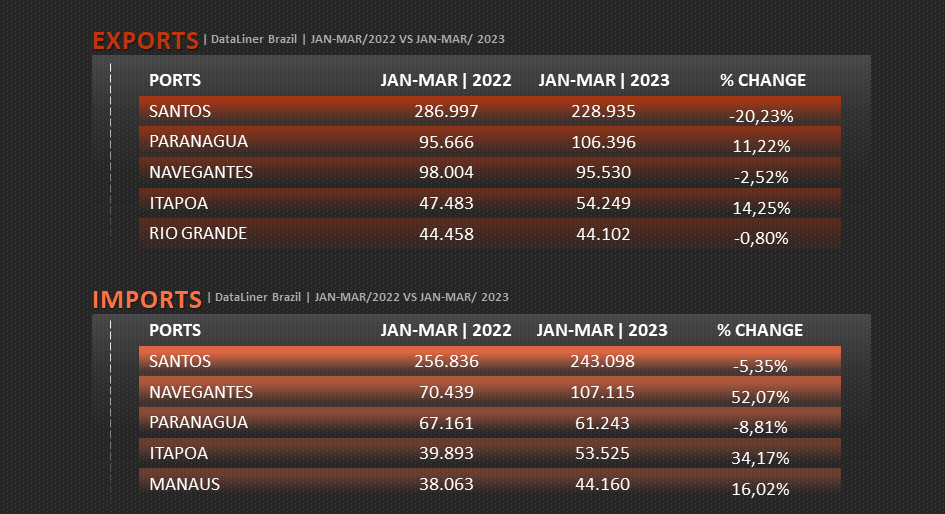
Keeping its traditional score regarding containerized cargo exports, the Port of Santos ranked first in the 1st quarter of 2023, with 228,935 TEUs handled, a performance that reveals a 20.23% drop compared to the same period last year.
The Port of Paranaguá, which ranked second in containerized cargo exports, handled 106,396 TEU between January and March this year, 11.22% more than in the same period last year. See more information in the table below:
Ranking of Brazilian Ports | Exports | Jan-Mar 2022 vs. Jan-Mar 2023 | TEU
Source: DataLiner (click here to request a demo)
The ranking of imports via containers also counts with the leadership of the Port of Santos, with 243,098 TEU imported, a number 5.35% lower than that seen last year. However, the Port of Navegantes, the country’s second-largest port in containerized cargo imports, recorded an impressive mark of 107,115 TEU, 52.07% more than in the first quarter of 2022.
In third place, the Port of Paranaguá imported 61,243 TEU, while Itapoá, in fourth place, saw 53,525 TEU in container imports, up 34.17% from the same period of last year. See more information below:
Ranking of Brazilian Ports | Imports | Jan-Mar 2022 vs. Jan-Mar 2023 | TEU
Source: DataLiner (click here to request a demo)
Plate region (Argentina, Uruguay, Paraguay)
In terms of exports, the Port of Buenos Aires scored the highest among the ports in the Plate region, with 85,355 TEU handled, indicating a simple growth of 1.65% compared to last year, a situation consistent with the current scenario of drought and currency crisis the country is going through.
The port of the Uruguayan capital faced a weak first quarter in container exports, documenting 49,015 TEU, down 16.13% compared to January-March 2022. Even so, the Port of Montevideo finished second in the ranking. See more below:
Ranking of Ports in the Plate Region | Exports | Jan-Mar 2022 vs. Jan-Mar 2023 | TEU
Source: DataLiner (click here to request a demo)
Last but not least, the port of Buenos Aires saw the importation of 106,473 TEU of containers, a drop of 23.51% over the first quarter of last year, also a reflection of the severe currency crisis and the depletion of dollar reserves in the country. The runner-up in the region was the Port of Montevideo, with 55,929 TEU imported via containers in the three-month period, according to DataLiner data.
Ranking of Ports in the Plate Region | Imports | Jan-Mar 2022 vs. Jan-Mar 2023 | TEU
-
Ports and Terminals
Sep, 20, 2024
0
Minister Padilha Announces Unprecedented Investments in Port of Santos and Baixada Santista
-
Trade Regulations
Jul, 04, 2019
0
Mercosur-EU agreement to increase competitiveness of Brazilian agriculture
-
Other Logistics
Sep, 10, 2024
0
Government changes railway route to counter legal challenge
-
Other Cargo
Jul, 24, 2023
0
Even with a reduction in honey exports in the 1st quarter, Brazil’s scenario is still sweet for 2023

