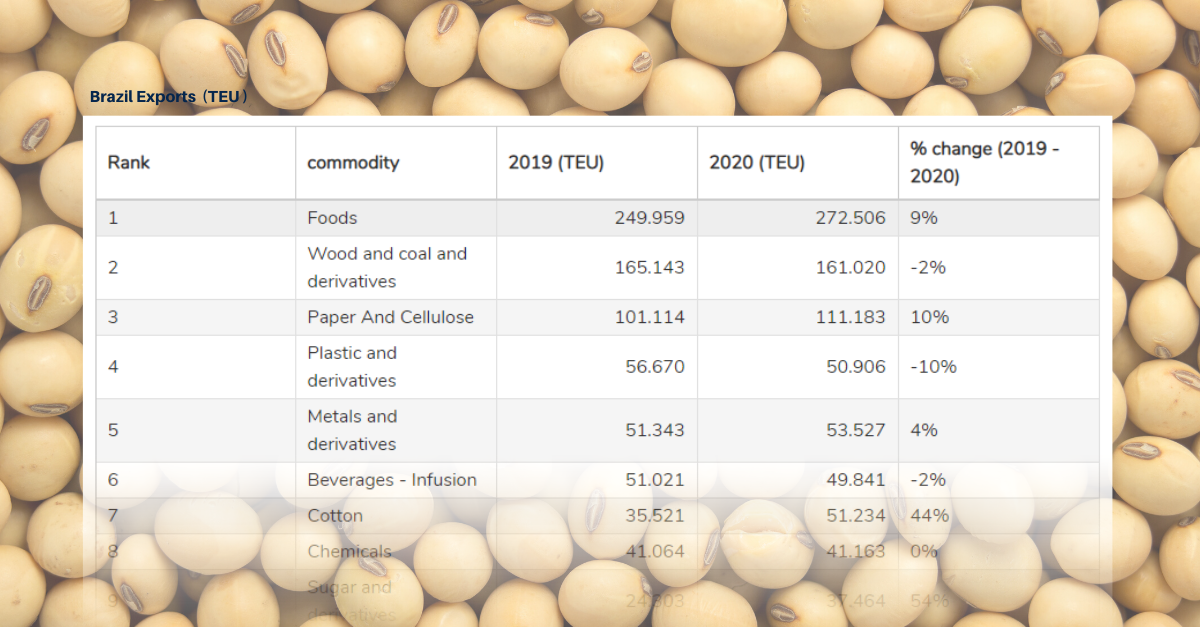
Commodity ranking for Brazil`s container shipping exports & imports in first five months of 2020
Jul, 08, 2020 Posted by datamarnewsWeek 202028
The Brazilian trade balance has been registering record surpluses so far this year, mainly attributed to the Coronavirus pandemic whereby the direction of world trade hs been changed, favoring exports of certain categories of Brazilian products. What are these categories? What were the most exported and imported goods by Brazil in containers in the first five months of the year?
The following rankings, based on DataLiner data, provides the answer to these questions and a comparison with the performance of each product category in 2020 in relation to the first five months of 2019:
Ranking of most exported goods from January- May 2020
On the export side, the top-ranking sector was food, which grew 9%, followed by paper and cellulose with 10% growth, then cotton with 44% growth, and sugar and ethanol which had an expressive volume increase of 54%. At the other extreme, rubber and derivatives as well as vehicles and auto parts suffered the largest drops in exports – 27% each.
Ranking Commodity - Exports
wdt_ID | Rank | commodity | 2019 (TEU) | 2020 (TEU) | % change (2019 - 2020) |
---|---|---|---|---|---|
1 | 1 | Foods | 249.959 | 272.506 | 9% |
2 | 2 | Wood and coal and derivatives | 165.143 | 161.020 | -2% |
3 | 3 | Paper And Cellulose | 101.114 | 111.183 | 10% |
4 | 4 | Plastic and derivatives | 56.670 | 50.906 | -10% |
5 | 5 | Metals and derivatives | 51.343 | 53.527 | 4% |
6 | 6 | Beverages - Infusion | 51.021 | 49.841 | -2% |
7 | 7 | Cotton | 35.521 | 51.234 | 44% |
8 | 8 | Chemicals | 41.064 | 41.163 | 0% |
9 | 9 | Sugar and derivatives | 24.303 | 37.464 | 54% |
10 | 10 | Reactors and boilers | 31.694 | 26.176 | -17% |
11 | 11 | Minerals and derivatives | 22.772 | 18.846 | -17% |
12 | 12 | Animal food | 20.260 | 19.788 | -2% |
13 | 13 | Textiles, derivatives and clothing | 20.861 | 18.427 | -12% |
14 | 14 | Rubber and derivatives | 22.236 | 16.194 | -27% |
15 | 15 | Vehicles and parts | 20.440 | 14.935 | -27% |
16 | Total | 916.422 | 945.230 | 3% | |
17 | Others | 145.595 | 142.736 | -2% | |
18 | Grand total | 1.062.017 | 1.087.966 | 2% |
Source: DataLiner
Ranking of the most imported goods from January to May 2020
Regarding imports, the biggest highlight is the fertilizer category with 58% growth, motivated by the good performance of Brazilian agribusiness. In the opposite direction, the biggest fall was also seen in imports of vehicles and auto parts, with a 19% year-on-year downturn.
Ranking Commodity - Imports
wdt_ID | Rank | Commodity | 2019 (TEU) | 2020 (TEU) | % change (2019 - 2020) |
---|---|---|---|---|---|
1 | 1 | Plastic and derivatives | 113.021 | 119.363 | 6% |
2 | 2 | Vehicles and parts | 114.651 | 92.688 | -19% |
3 | 3 | Chemicals | 93.940 | 102.076 | 9% |
4 | 4 | Reactors and boilers | 92.605 | 88.509 | -4% |
5 | 5 | Electric machines | 69.653 | 77.301 | 11% |
6 | 6 | Textiles, derivatives and clothing | 68.915 | 59.742 | -13% |
7 | 7 | Metals and derivatives | 63.071 | 63.347 | 0% |
8 | 8 | Foods | 39.655 | 38.825 | -2% |
9 | 9 | Rubber and derivatives | 37.587 | 33.552 | -11% |
10 | 10 | Paper And Cellulose | 26.540 | 29.488 | 11% |
11 | 11 | Fertilizer | 16.512 | 26.090 | 58% |
12 | 12 | Glass and derivatives | 16.832 | 15.503 | -8% |
13 | 13 | Furniture | 14.866 | 12.297 | -17% |
14 | 14 | Salt, plaster, cement | 12.015 | 14.590 | 21% |
15 | 15 | Drinks | 13.043 | 12.631 | -3% |
16 | Total | 794.927 | 788.021 | -1% | |
17 | Others | 151.408 | 163.081 | 8% | |
18 | Grand total | 946.335 | 951.102 | 1% |
Source: DataLiner
-
Meat
Jan, 09, 2024
0
Record-Breaking Year: Brazilian Pork Exports Experience 9% Growth in Volume and Revenue in 2023
-
Ports and Terminals
Feb, 16, 2020
0
Port of Rio de Janeiro registers 7.42 million tons throughput
-
Meat
Jul, 07, 2023
0
Brazil sees 2nd largest beef export volume in 2023 despite Chinese embargo
-
Meat
Nov, 06, 2019
0
Cofco to purchase US$100m in Danish Crown pork in 2020