Ranking of Brazil and Plate ports | Jan. to Dec. 2020 and Jan. to Dec. 2021
Apr, 20, 2022 Posted by Gabriel MalheirosWeek 202217
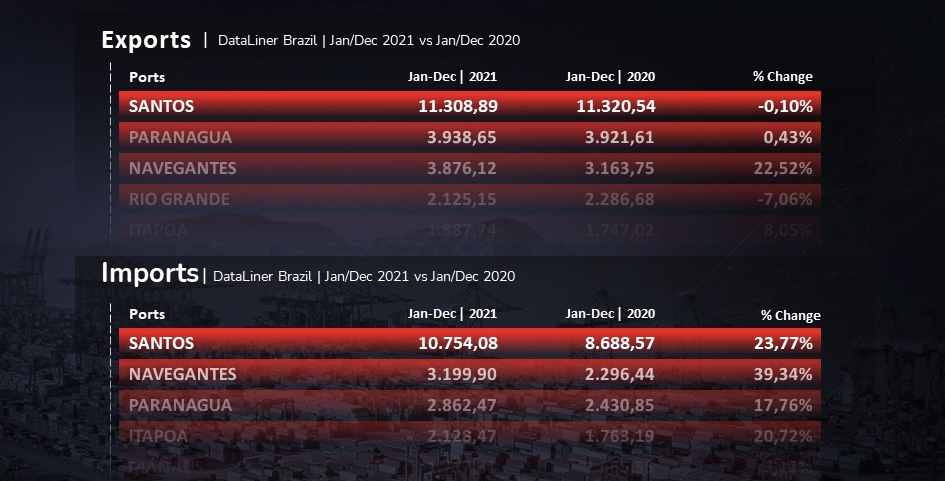
See below the port ranking for Brazil and the Plate region in terms of most exported and imported containers in 2021 compared to 2020. The data are from DataLiner.
Brazil
The Port of Santos maintains the leadership in exports with 1,130,889 TEUs, a slight drop of 0.10% compared to 2020 volumes.
Ranking of Brazilian Ports | Exports | Jan/Dec 2021 vs. Jan/Dec 2020 | TEU
wdt_ID | Rank | Ports | Jan-Dec | 2021 | Jan-Dec | 2020 | % Change |
---|---|---|---|---|---|
1 | 1 | SANTOS | 1.130.889 | 1.132.054 | -0.10% |
2 | 2 | PARANAGUA | 393.865 | 392.161 | 0.43% |
3 | 3 | NAVEGANTES | 387.612 | 316.375 | 22.52% |
4 | 4 | RIO GRANDE | 212.515 | 228.668 | -7.06% |
5 | 5 | ITAPOA | 188.774 | 174.702 | 8.05% |
6 | 6 | ITAJAI | 134.112 | 162.605 | -17.52% |
7 | 7 | SALVADOR | 88.165 | 94.960 | -7.16% |
8 | 8 | RIO DE JANEIRO | 86.856 | 93.722 | -7.33% |
9 | 9 | VITORIA | 71.616 | 74.287 | -3.60% |
10 | 10 | VILA DO CONDE | 54.241 | 51.876 | 4.56% |
11 | 11 | PECEM | 47.345 | 39.157 | 20.91% |
12 | 12 | FORTALEZA | 27.947 | 18.672 | 49.67% |
13 | 13 | SUAPE | 26.471 | 24.200 | 9.38% |
14 | 14 | ITAGUAI | 24.387 | 26.139 | -6.70% |
15 | 15 | NATAL | 23.734 | 24.034 | -1.25% |
16 | 16 | MANAUS | 17.755 | 14.941 | 18.83% |
17 | OTHERS | 891 | 947 | -5.91% | |
18 | TOTAL | 2.917.174 | 2.869.501 | 1.66% |
Source: DataLiner (click here to request a demo)
There was growth in imports. The Port of Santos handled 1,075,408 TEUs, an increase of 23.77% compared to 2021. Navegantes, in second place, grew 39.34% year on year.
Ranking of Brazilian Ports | Imports | Jan/Dec 2021 vs. Jan/Dec 2020 | TEU
wdt_ID | Rank | Ports | Jan-Dec | 2021 | Jan-Dec | 2020 | % Change |
---|---|---|---|---|---|
1 | 1 | SANTOS | 1.075.408 | 868.857 | 23.77% |
2 | 2 | NAVEGANTES | 319.990 | 229.644 | 39.34% |
3 | 3 | PARANAGUA | 286.247 | 243.085 | 17.76% |
4 | 4 | ITAPOA | 212.847 | 176.319 | 20.72% |
5 | 5 | MANAUS | 171.731 | 166.555 | 3.11% |
6 | 6 | ITAJAI | 151.726 | 140.499 | 7.99% |
7 | 7 | RIO DE JANEIRO | 124.844 | 116.578 | 7.09% |
8 | 8 | SUAPE | 87.502 | 80.722 | 8.40% |
9 | 9 | SALVADOR | 72.466 | 68.052 | 6.49% |
10 | 10 | RIO GRANDE | 64.968 | 67.843 | -4.24% |
11 | 11 | VITORIA | 52.140 | 57.422 | -9.20% |
12 | 12 | PECEM | 30.111 | 38.107 | -20.98% |
13 | 13 | ITAGUAI | 15.212 | 24.093 | -36.86% |
14 | 14 | VILA DO CONDE | 6.345 | 8.146 | -22.11% |
15 | 15 | FORTALEZA | 2.021 | 1.603 | 26.08% |
16 | 16 | NATAL | 656 | 425 | 54.17% |
17 | OUTROS | 452 | 1.269 | -64.38% | |
18 | TOTAL | 2.674.665 | 2.289.219 | 16.84% |
Source: DataLiner (click here to request a demo)
Plate
The Port of Buenos Aires led exports in the Plate region in 2021, with 389,298 TEUs, down 7.85% compared to 2020. The Port of Montevideo ranked second, increasing shipments by 10.46%.
Ranking of Plate region Ports | Exports | Jan/Dec 2021 vs. Jan/Dec 2020 | TEU
wdt_ID | Rank | Ports | Jan-Dec | 2021 | Jan-Dec | 2020 | % Change |
---|---|---|---|---|---|
1 | 1 | BUENOS AIRES | 389.298 | 422.460 | -7.85% |
2 | 2 | MONTEVIDEO | 229.539 | 207.811 | 10.46% |
3 | 3 | ZARATE | 37.298 | 31.846 | 17.12% |
4 | 4 | ROSARIO | 15.850 | 19.070 | -16.88% |
5 | 5 | SAN ANTONIO ESTE | 12.748 | 13.334 | -4.40% |
6 | 6 | PUERTO MADRYN | 4.087 | 7.975 | -48.75% |
7 | 7 | BAHIA BLANCA | 3.608 | 8.949 | -59.68% |
8 | 8 | LA PLATA | 2.414 | 729 | 231.14% |
9 | TOTAL | 694.843 | 712.173 | -2.43% |
Source: DataLiner (click here to request a demo)
Regarding imports, the Port of Buenos Aires handled a volume 10.75% higher than 2020, while the second place, Montevideo, handled a volume 33.56% greater.
Ranking of Plate region Ports | Imports | Jan/Dec 2021 vs. Jan/Dec 2020 | TEU
wdt_ID | Rank | Ports | Jan-Dec | 2021 | Jan-Dec | 2020 | % Change |
---|---|---|---|---|---|
1 | 1 | BUENOS AIRES | 544.850 | 491.954 | 10.75% |
2 | 2 | MONTEVIDEO | 211.091 | 158.053 | 33.56% |
3 | 3 | ZARATE | 51.431 | 44.316 | 16.05% |
4 | 4 | ROSARIO | 26.745 | 20.663 | 29.43% |
5 | 5 | USHUAIA | 15.212 | 15.814 | -3.81% |
6 | 6 | PUERTO MADRYN | 1.800 | 1.967 | -8.49% |
7 | 7 | PUERTO DESEADO | 433 | 462 | -6.28% |
8 | 8 | BAHIA BLANCA | 198 | 234 | -15.38% |
9 | 9 | MAR DEL PLATA | 175 | 125 | 40.00% |
10 | 10 | SANTA FE | 131 | 44 | 197.73% |
11 | 11 | LAS PALMAS +AR | 114 | 104 | 9.62% |
12 | 12 | CAMPANA | 25 | 2 | 1150.00% |
13 | 13 | LA PLATA | 22 | 4 | 450.00% |
14 | TOTAL | 852.226 | 733.741 | 16.15% |
-
Oil and Gas
Jun, 23, 2022
0
Glycerin exports surpass US$ 40 million mark for the first time
-
Ports and Terminals
Dec, 09, 2020
0
Brazilian coffee exports up 32.2% YoY setting record for November
-
Nov, 30, 2021
0
“Superships” can reduce emissions from agricultural trade
-
Shipping
Feb, 10, 2020
0
Shipping lines report low demand for container vessels amid coronavirus outbreak