Ranking of Brazilian and Plate Ports – Jan to Apr 2022 vs. Jan to April 2021
Jul, 04, 2022 Posted by Gabriel MalheirosWeek 202227
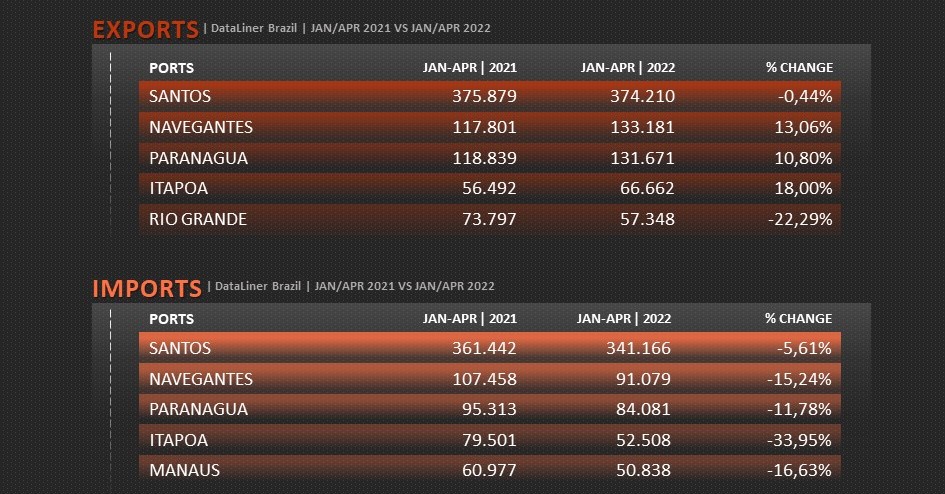
See below the ranking of Brazilian and Plate ports with the largest export and import numbers in terms of containers in the first four months of 2022 and compared to the same period in 2021. The data are from the DataLiner:
Brazil
The Port of Santos continues to lead exports via containers, with 374,210 TEUs, a slight decrease of 0.44% compared to the period from January to April 2021. The Port of Navegantes, in second place, grew 13.06% in the same comparison. The biggest drop observed in the period from January to April 2022 versus January to April 2021 was -36.30% in the Port of Itajaí. See more below:
Ranking of Brazilian Ports | Exports | Jan/Apr 2021 vs. Jan/Apr 2022 | TEU
Source: DataLiner (click here to request a demo)
In imports, the Port of Santos also maintained its leadership, with 341,166 TEUs, a drop of 5.61% compared to the first four months of 2021. The Port of Navegantes, on the other hand, imported a volume 15.24% lower between the two periods. See more of it below:
Ranking of Brazilian Ports | Imports | Jan/Apr 2021 vs. Jan/Apr 2022 | TEU
Source: DataLiner (click here to request a demo)
Plate (Paraguay, Uruguay, Argentina)
In the Plate region, which includes Argentina, Paraguay, and Uruguay, the lead in exports in the first four months of 2022 is the Port of Buenos Aires, which had a container throughput 7.67% smaller than in the same period of 2021. On the other hand, the port that ranked second, the Port of Montevideo, handled a volume 22.44% higher. Check it out below:
Ranking of Ports in the Plate region | Exports | Jan/Apr 2021 vs. Jan/Apr 2022 | TEU
Source: DataLiner (click here to request a demo)
In terms of imports, the Port of Buenos Aires saw a 1.59% smaller volume throughput from January to April 2022 than in the same period in 2021. The second in the ranking, the Port of Montevideo, imported a volume of 13.17% larger. Check it out below:
Ranking of Ports in the Plate region | Imports | Jan/Apr 2021 vs. Jan/Apr 2022 | TEU
-
Dec, 01, 2021
0
Rumo and Hidrovias do Brasil subsidiary sign memorandum to transport fertilizers
-
Ports and Terminals
Sep, 14, 2021
0
Antaq to auction leases for two liquid terminals at Santos
-
Meat
Jul, 08, 2024
0
Pork exports in June below June/23, but exceed May/24
-
Meat
Mar, 31, 2022
0
China to buy 40,000 t of frozen pork destined to its state reserves

