Ranking of Brazilian and Plate Ports | Jan to Mar | 2022 – 2021
May, 05, 2022 Posted by Sylvia SchandertWeek 202219
See below the ranking of Brazilian and Plate ports with the highest flow of containerized cargo in the first quarter of 2022 compared to 2021. The data are from DataLiner.
Brazil
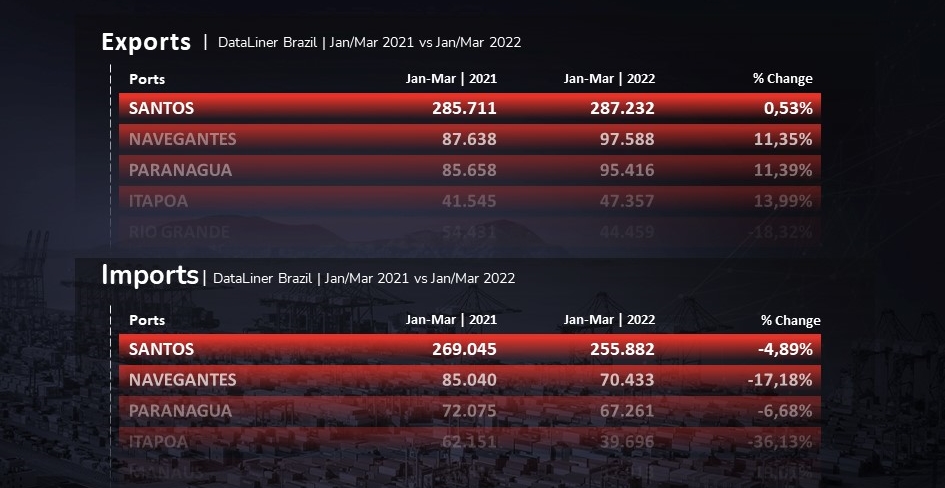
In the first quarter of 2022, the Port of Santos once again scored the highest in terms of containerized cargo handling with 287,232 TEUs shipped, up 0.53% from the same period in 2021. Navegantes, the second in the export rank, handled 97,588 TEUs, a growth of 11.35% over 2021. See below the performance of other ports below:
Ranking of Brazilian Ports | Exports | Jan/Mar 2021 vs. Jan/Mar 2022 | TEU
wdt_ID | Rank | Ports | Jan-Mar | 2021 | Jan-Mar | 2022 | % Change |
---|---|---|---|---|---|
1 | 1 | SANTOS | 285,711 | 287,232 | 0.53% |
2 | 2 | NAVEGANTES | 87,638 | 97,588 | 11.35% |
3 | 3 | PARANAGUA | 85,658 | 95,416 | 11.39% |
4 | 4 | ITAPOA | 41,545 | 47,357 | 13.99% |
5 | 5 | RIO GRANDE | 54,431 | 44,459 | -18.32% |
6 | 6 | RIO DE JANEIRO | 21,980 | 22,973 | 4.52% |
7 | 7 | ITAJAI | 33,661 | 21,225 | -36.94% |
8 | 8 | SALVADOR | 19,609 | 19,157 | -2.31% |
9 | 9 | VILA DO CONDE | 14,105 | 13,315 | -5.60% |
10 | 10 | VITORIA | 16,108 | 11,925 | -25.97% |
11 | 11 | PECEM | 9,062 | 8,290 | -8.52% |
12 | 12 | FORTALEZA | 9,629 | 7,234 | -24.87% |
13 | 13 | SUAPE | 6,235 | 6,084 | -2.42% |
14 | 14 | NATAL | 2,315 | 5,147 | 122.33% |
15 | 15 | MANAUS | 4,186 | 4,460 | 6.55% |
16 | 16 | ITAGUAI | 6,587 | 4,046 | -38.58% |
17 | OTHERS | 207 | 197 | -4.83% | |
18 | TOTAL | 698,668 | 696,105 | -0.37% |
Source: DataLiner (click here to request a demo)
As for imports, the Port of Santos received 255,882 TEUs between January and March 2022, a drop of 4.89% compared to the first quarter of 2021. Navegantes, second in the ranking, saw a greater drop in imports (-17.18%) with 70,433 TEUs received. Check out the full ranking below:
Ranking of Brazilian Ports | Imports | Jan/Mar 2021 vs. Jan/Mar 2022 | TEU
wdt_ID | Rank | Ports | Jan-Mar | 2021 | Jan-Mar | 2022 | % Change |
---|---|---|---|---|---|
1 | 1 | SANTOS | 269,045 | 255,882 | -4.89% |
2 | 2 | NAVEGANTES | 85,040 | 70,433 | -17.18% |
3 | 3 | PARANAGUA | 72,075 | 67,261 | -6.68% |
4 | 4 | ITAPOA | 62,151 | 39,696 | -36.13% |
5 | 5 | MANAUS | 46,814 | 37,913 | -19.01% |
6 | 6 | ITAJAI | 46,259 | 34,998 | -24.34% |
7 | 7 | RIO DE JANEIRO | 33,216 | 27,462 | -17.32% |
8 | 8 | SUAPE | 26,505 | 21,142 | -20.23% |
9 | 9 | SALVADOR | 21,859 | 14,698 | -32.76% |
10 | 10 | VITORIA | 19,024 | 13,915 | -26.86% |
11 | 11 | RIO GRANDE | 21,346 | 12,763 | -40.21% |
12 | 12 | PECEM | 10,851 | 7,690 | -29.13% |
13 | 13 | VILA DO CONDE | 2,206 | 1,705 | -22.71% |
14 | 14 | ITAGUAI | 5,675 | 1,327 | -76.62% |
15 | 15 | FORTALEZA | 606 | 342 | -43.56% |
16 | 16 | NATAL | 118 | 157 | 33.05% |
17 | OTHERS | 238 | 30 | -87.39% | |
18 | TOTAL | 723,029 | 607,415 | -15.99% |
Source: DataLiner (click here to request a demo)
Plate
The Port of Buenos Aires stands out in the Plate region, which encompasses Argentina, Paraguay, and Uruguay, in terms of exports despite the 12.21% drop in shipments seen in the first quarter of 2022 compared to the same period in 2021. The Port of Montevideo, in second place, grew 22.06% in the same comparison. Check out the ranking of the region below:
Ranking of Ports in the Plate region | Exports | Jan/Mar 2021 vs. Jan/Mar 2022 | TEU
wdt_ID | Rank | Ports | Jan-Mar | 2021 | Jan-Mar | 2022 | % Change |
---|---|---|---|---|---|
1 | 1 | BUENOS AIRES | 95,484 | 83,825 | -12.21% |
2 | 2 | MONTEVIDEO | 47,879 | 58,443 | 22.06% |
3 | 3 | ZARATE | 6,206 | 6,524 | 5.12% |
4 | 4 | ROSARIO | 3,185 | 2,161 | -32.15% |
5 | 5 | SAN ANTONIO ESTE | 6,730 | 1,964 | -70.82% |
6 | 6 | LA PLATA | 255 | 595 | 133.33% |
7 | 7 | PUERTO MADRYN | 2,151 | 0 | -100.00% |
8 | 8 | BAHIA BLANCA | 1,353 | 0 | -100.00% |
9 | TOTAL | 163,243 | 153,513 | -5.96% |
Source: DataLiner (click here to request a demo)
Finally, in terms of imports, while container throughput at the Port of Buenos Aires fell 5.76% in the first quarter of 2022, the Port of Montevideo increased its handling rates by 9.81%.
Ranking of Ports in the Plate region | Imports | Jan/Mar 2021 vs. Jan/Mar 2022 | TEU
wdt_ID | Rank | Ports | Jan-Mar | 2021 | Jan-Mar | 2022 | % Change |
---|---|---|---|---|---|
1 | 1 | BUENOS AIRES | 146,748 | 138,298 | -5.76% |
2 | 2 | MONTEVIDEO | 49,169 | 53,992 | 9.81% |
3 | 3 | ZARATE | 11,191 | 12,977 | 15.96% |
4 | 4 | ROSARIO | 5,671 | 7,309 | 28.90% |
5 | 5 | USHUAIA | 5,672 | 3,018 | -46.79% |
6 | 6 | PUERTO MADRYN | 368 | 492 | 33.70% |
7 | 7 | PUERTO DESEADO | 38 | 96 | 152.63% |
8 | 8 | SANTA FE | 17 | 54 | 217.65% |
9 | 9 | MAR DEL PLATA | 32 | 17 | -46.88% |
10 | 10 | BAHIA BLANCA | 107 | 9 | -91.59% |
11 | 11 | LA PLATA | 8 | 3 | -62.50% |
12 | 12 | CALETA CORDOBA | 0 | 2 | 100.00% |
13 | 13 | LAS PALMAS | 57 | 0 | -100.00% |
14 | TOTAL | 219,076 | 216,267 | -1.28% |
-
Ports and Terminals
Aug, 09, 2024
0
Increased inbound operations with vehicles create bottlenecks for other cargoes in Brazil’s Espirito Santo
-
Other Logistics
May, 19, 2022
0
Air France-KLM and CMA CGM announce agreement to unite air transport operations
-
Ports and Terminals
May, 20, 2021
0
Port of Antonina specializes in high-value cargo and a short waiting periods for ships
-
Other Logistics
Feb, 18, 2022
0
Grimaldi roro ablaze off Corfu