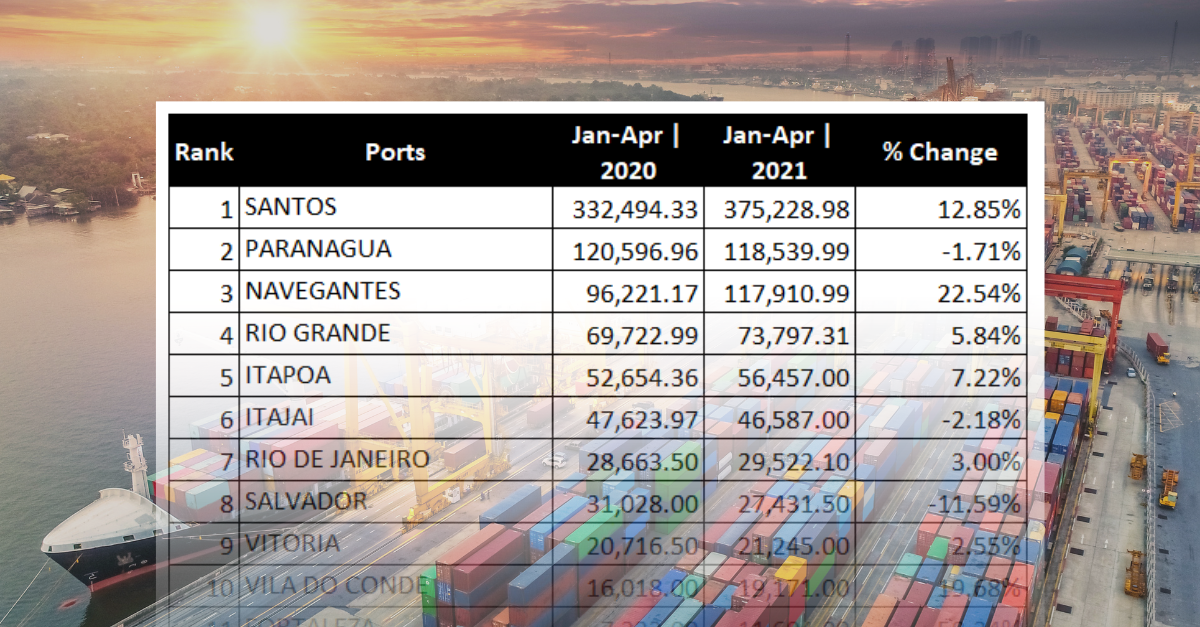
Ranking of Brazilian and Plate Ports – January to April 2020 and January to April 2021
Jun, 08, 2021 Posted by Ruth HollardWeek 202125
The DatamarNews team prepared a ranking of the Brazilian ports and the Plate region that handled the most cargo from January to April 2020 and January to April 2021 based on DataLiner data. The results can be seen below:
Brazil
In exports, the Port of Santos maintains its leadership, with growth of 12.85% in the first four months of 2021 compared to the same period in 2020. By comparison, third-place Port of Navegantes recorded growth of 22.54% in exports. In imports, the Port of Navegantes ranks second, with growth of 47.83% in the four-month period.
Ranking of Brazilian Ports| Exports | Jan-Apr 2020 vs. Jan-Apr 2021 | TEU
wdt_ID | Rank | Ports | Jan-Apr | 2020 | Jan-Apr | 2021 | % Change |
---|---|---|---|---|---|
1 | 1 | SANTOS | 332,494.33 | 375,228.98 | 12.85% |
2 | 2 | PARANAGUA | 120,596.96 | 118,539.99 | -1.71% |
3 | 3 | NAVEGANTES | 96,221.17 | 117,910.99 | 22.54% |
4 | 4 | RIO GRANDE | 69,722.99 | 73,797.31 | 5.84% |
5 | 5 | ITAPOA | 52,654.36 | 56,457.00 | 7.22% |
6 | 6 | ITAJAI | 47,623.97 | 46,587.00 | -2.18% |
7 | 7 | RIO DE JANEIRO | 28,663.50 | 29,522.10 | 3.00% |
8 | 8 | SALVADOR | 31,028.00 | 27,431.50 | -11.59% |
9 | 9 | VITORIA | 20,716.50 | 21,245.00 | 2.55% |
10 | 10 | VILA DO CONDE | 16,018.00 | 19,171.00 | 19.68% |
11 | 11 | FORTALEZA | 7,333.00 | 11,604.00 | 58.24% |
12 | 12 | PECEM | 8,200.00 | 10,926.00 | 33.24% |
13 | 13 | ITAGUAI | 8,245.00 | 8,349.00 | 1.26% |
14 | 14 | SUAPE | 7,388.00 | 8,214.00 | 11.18% |
15 | 15 | MANAUS | 4,769.00 | 5,864.00 | 22.96% |
16 | 16 | NATAL | 5,864.00 | 4,005.00 | -31.70% |
17 | OTHERS | 301.00 | 286.00 | -4.98% |
Graph source: DataLiner (click here to request a demo)
Ranking of Brazilian Ports| Imports | Jan-Apr 2020 vs. Jan-Apr 2021 | TEU
wdt_ID | Rank | Ports | Jan-Apr | 2020 | Jan-Apr | 2021 | % Change |
---|---|---|---|---|---|
1 | 1 | SANTOS | 307,920.05 | 361,257.32 | 17.32% |
2 | 2 | NAVEGANTES | 72,644.00 | 107,392.78 | 47.83% |
3 | 3 | PARANAGUA | 83,887.00 | 95,203.16 | 13.49% |
4 | 4 | ITAPOA | 63,745.17 | 79,498.00 | 24.71% |
5 | 5 | MANAUS | 56,211.19 | 61,026.00 | 8.57% |
6 | 6 | ITAJAI | 50,740.39 | 58,116.26 | 14.54% |
7 | 7 | RIO DE JANEIRO | 40,329.50 | 42,854.99 | 6.26% |
8 | 8 | SUAPE | 29,013.56 | 34,084.00 | 17.48% |
9 | 9 | SALVADOR | 23,315.33 | 27,781.43 | 19.16% |
10 | 10 | RIO GRANDE | 24,891.00 | 26,906.02 | 8.10% |
11 | 11 | VITORIA | 18,747.50 | 23,842.00 | 27.17% |
12 | 12 | PECEM | 11,494.20 | 12,987.00 | 12.99% |
13 | 13 | ITAGUAI | 8,704.00 | 7,404.00 | -14.94% |
14 | 14 | VILA DO CONDE | 2,776.00 | 2,664.00 | -4.03% |
15 | 15 | FORTALEZA | 557.00 | 719.00 | 29.08% |
16 | 16 | NATAL | 193.50 | 140.00 | -27.65% |
17 | OTHERS | 572.00 | 293.00 | -48.78% |
Graph source: DataLiner (click here to request a demo)
Plate
Buenos Aires led exports for the Plate, which had a drop of 0.52% in volume in the first four months of 2021 compared to the same period in 2020. In terms of imports, growth was 11.20% in the same period.
Ranking of the Plate Region Ports | Exports | Jan-Apr 2020 vs. Jan-Apr 2021 | TEU
wdt_ID | Rank | Ports | Jan-Apr | 2020 | Jan-Apr | 2021 | % Change |
---|---|---|---|---|---|
1 | 1 | BUENOS AIRES | 122,932.72 | 122,287.66 | -0.52% |
2 | 2 | MONTEVIDEO | 61,066.56 | 64,785.33 | 6.09% |
3 | 3 | SAN ANTONIO ESTE | 10,534.05 | 10,136.00 | -3.78% |
4 | 4 | ZARATE | 8,231.00 | 8,852.00 | 7.54% |
5 | 5 | ROSARIO | 7,255.67 | 4,508.00 | -37.87% |
6 | 6 | PUERTO MADRYN | 2,347.00 | 2,790.00 | 18.88% |
7 | 7 | BAHIA BLANCA | 3,059.62 | 1,956.00 | -36.07% |
8 | 8 | LA PLATA | 544.00 | 535.00 | -1.65% |
Graph source: DataLiner (click here to request a demo)
Rankng of the Plate Region Ports | Imports | Jan-Apr 2020 vs. Jan-Apr 2021 | TEU
wdt_ID | Rank | Ports | Jan-Apr | 2020 | Jan-Apr | 2021 | % Change |
---|---|---|---|---|---|
1 | 1 | BUENOS AIRES | 167,674.50 | 186,457.91 | 11.20% |
2 | 2 | MONTEVIDEO | 48,438.00 | 61,169.56 | 26.28% |
3 | 3 | ZARATE | 14,272.00 | 15,139.50 | 6.08% |
4 | 4 | ROSARIO | 6,992.00 | 8,048.50 | 15.11% |
5 | 5 | USHUAIA | 6,203.00 | 7,275.00 | 17.28% |
6 | 6 | PUERTO MADRYN | 967.00 | 515.00 | -46.74% |
7 | 7 | BAHIA BLANCA | 60.00 | 123.00 | 105.00% |
8 | 8 | PUERTO DESEADO | 129.00 | 77.00 | -40.31% |
9 | 9 | LAS PALMAS +AR | 17.00 | 57.00 | 235.29% |
10 | 10 | MAR DEL PLATA | 34.00 | 50.00 | 47.06% |
11 | 11 | SANTA FE | 10.00 | 23.00 | 130.00% |
12 | 12 | LA PLATA | 0.00 | 8.00 | 100.00% |
13 | 13 | CALETA OLIVIA | 7.00 | 0.00 | -100.00% |
Graph source: DataLiner (click here to request a demo)
-
Environment
Apr, 25, 2023
0
HMM has cut carbon emissions by half in last decade
-
Sugar and Ethanol
Jun, 12, 2023
0
Sugar: vessel line-up in Brazil reveals 2.596 mt in future shipments
-
Meat
Sep, 10, 2024
0
Canada re-authorizes imports of beef from Brazilian areas without FMD vaccination
-
Coffee
Jan, 18, 2024
0
Brazil’s coffee production to rise 5.5% in 2024, says Conab