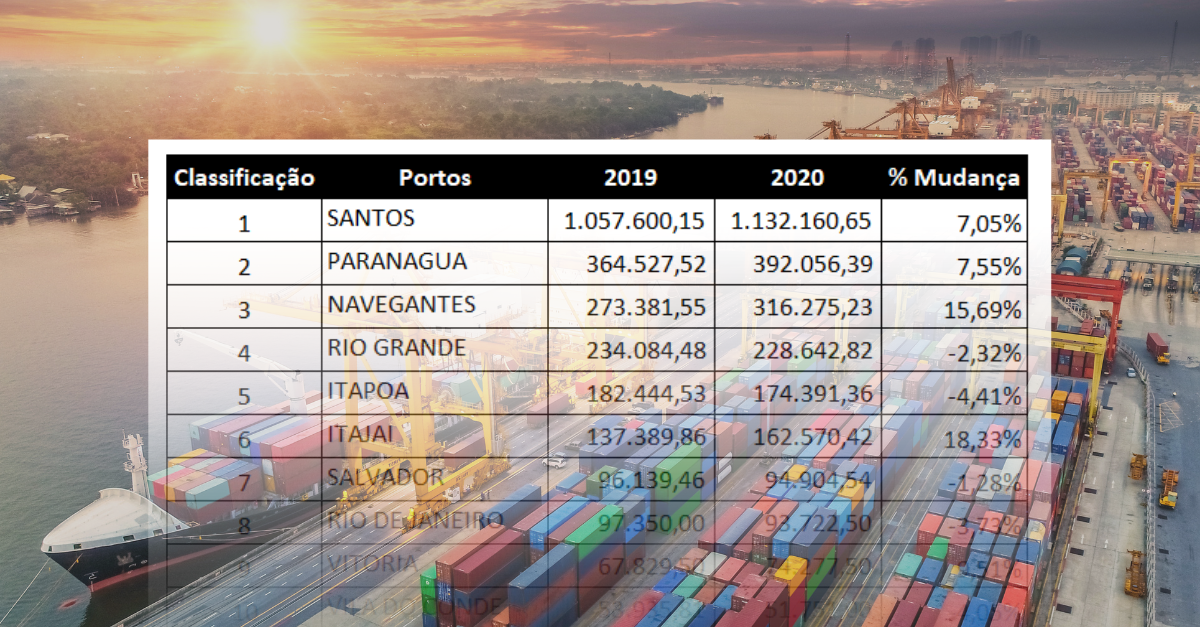
Ranking of Brazilian and Plate ports – January to December 2020
Feb, 17, 2021 Posted by Ruth HollardWeek 202107
Which Brazilian and Plate ports performed the best in 2020? Which recorded the greatest growth? And the biggest drop? See the results of a survey conducted by the DatamarNews team based on DataLiner data on the performance of ports in 2020 and the comparison with 2019:
Brazil
The Port of Santos was the port that exported the most in 2020, with 1,132,161 TEU sent abroad, an increase of 7.05% in relation to 2019. The biggest drop in exports was in the Port of Fortaleza, which fell 28.39%.
Ranking of Brazilian Ports | Exports | Jan to Dec 2019-2020 | TEU
wdt_ID | Classificação | Portos | 2019 | 2020 | % Mudança |
---|---|---|---|---|---|
1 | 1 | SANTOS | 1.057.600 | 1.132.161 | 7.05% |
2 | 2 | PARANAGUA | 364.528 | 392.056 | 7.55% |
3 | 3 | NAVEGANTES | 273.382 | 316.275 | 15.69% |
4 | 4 | RIO GRANDE | 234.084 | 228.643 | -2.32% |
5 | 5 | ITAPOA | 182.445 | 174.391 | -4.41% |
6 | 6 | ITAJAI | 137.390 | 162.570 | 18.33% |
7 | 7 | SALVADOR | 96.139 | 94.905 | -1.28% |
8 | 8 | RIO DE JANEIRO | 97.350 | 93.723 | -3.73% |
9 | 9 | VITORIA | 67.829 | 74.277 | 9.51% |
10 | 10 | VILA DO CONDE | 53.936 | 51.751 | -4.05% |
11 | 11 | PECEM | 26.711 | 39.157 | 46.60% |
12 | 12 | PORTO DE ITAGUAI | 32.034 | 26.102 | -18.52% |
13 | 13 | NATAL | 22.418 | 24.034 | 7.21% |
14 | 14 | SUAPE | 22.290 | 24.017 | 7.75% |
15 | 15 | FORTALEZA | 26.074 | 18.672 | -28.39% |
16 | 16 | MANAUS | 17.411 | 14.772 | -15.16% |
17 | OUTROS | 2.116 | 944 | -55.39% |
Source: DataLiner
In imports, the positive highlight was the Port of Itajaí, which grew 20.32% in 2020, to 140,503 TEU.
Ranking of Brazilian Ports | Imports | Jan to Dec 2019-2020 | TEU
wdt_ID | Classificação | Portos | 2019 | 2020 | % Mudança |
---|---|---|---|---|---|
1 | 1 | SANTOS | 966.694 | 867.848 | -10.23% |
2 | 2 | PARANAGUA | 246.093 | 243.056 | -1.23% |
3 | 3 | NAVEGANTES | 222.429 | 229.642 | 3.24% |
4 | 4 | ITAPOA | 186.718 | 176.212 | -5.63% |
5 | 5 | MANAUS | 156.598 | 165.828 | 5.89% |
6 | 6 | ITAJAI | 116.775 | 140.503 | 20.32% |
7 | 7 | RIO DE JANEIRO | 131.290 | 116.511 | -11.26% |
8 | 8 | SUAPE | 82.161 | 80.629 | -1.87% |
9 | 9 | RIO GRANDE | 77.952 | 67.418 | -13.51% |
10 | 10 | SALVADOR | 71.062 | 67.351 | -5.22% |
11 | 11 | VITORIA | 63.273 | 57.183 | -9.63% |
12 | 12 | PECEM | 31.712 | 37.914 | 19.56% |
13 | 13 | PORTO DE ITAGUAI | 40.439 | 24.048 | -40.53% |
14 | 14 | VILA DO CONDE | 7.709 | 8.129 | 5.45% |
15 | 15 | FORTALEZA | 2.346 | 1.600 | -31.78% |
16 | 16 | NATAL | 857 | 425 | -50.35% |
17 | OTHERS | 1.795 | 1.239 | -30.97% |
Source: DataLiner
Plate
In the Plate region, the leadership in exports was the Port of Buenos Aires, which grew 7.72%. The Port of Montevideo registered 4.95% growth in the same period.
Ranking of Ports in the Plate region | Export | Jan to Dec 2019-2020 | TEU
wdt_ID | Classificação | Portos | 2019 | 2020 | % Mudança |
---|---|---|---|---|---|
1 | 1 | BUENOS AIRES | 399.498 | 422.352 | 5.72% |
2 | 2 | MONTEVIDEO | 197.967 | 207.776 | 4.95% |
3 | 3 | ZARATE | 31.853 | 31.827 | -0.08% |
4 | 4 | ROSARIO | 23.182 | 19.058 | -17.79% |
5 | 5 | SAN ANTONIO ESTE | 10.756 | 13.334 | 23.97% |
6 | 6 | BAHIA BLANCA | 11.102 | 8.910 | -19.75% |
7 | 7 | PUERTO MADRYN | 10.298 | 7.969 | -22.62% |
8 | 8 | LA PLATA | 1.627 | 729 | -55.19% |
9 | 9 | MAR DEL PLATA | 42 | 716 | 1604.76% |
10 | 10 | PUERTO DESEADO | 252 | 708 | 180.95% |
Source: DataLiner
In imports, most of the ports have decreased handling. While imports fell 8.02% at the Port of Buenos Aires, at the Port of Montevideo, imports fell 2.60%.
Ranking of Ports in the Plate region | Imports | Jan to Dec 2019-2020 | TEU
wdt_ID | Classificação | Portos | 2019 | 2020 | % Mudança |
---|---|---|---|---|---|
1 | 1 | BUENOS AIRES | 533.421 | 490.625 | -8.02% |
2 | 2 | MONTEVIDEO | 161.633 | 157.434 | -2.60% |
3 | 3 | ZARATE | 54.848 | 44.275 | -19.28% |
4 | 4 | ROSARIO | 20.221 | 20.564 | 1.70% |
5 | 5 | USHUAIA | 12.793 | 15.785 | 23.39% |
6 | 6 | PUERTO MADRYN | 2.632 | 1.932 | -26.60% |
7 | 7 | PUERTO DESEADO | 965 | 462 | -52.12% |
8 | 8 | BAHIA BLANCA | 924 | 225 | -75.65% |
9 | 9 | MAR DEL PLATA | 294 | 125 | -57.48% |
10 | 10 | LAS PALMAS +AR | 2.201 | 104 | -95.27% |
11 | 11 | SANTA FE | 43 | 44 | 2.33% |
12 | 12 | CALETA OLIVIA | 0 | 7 | 0.00% |
13 | 13 | LA PLATA | 2 | 4 | 100.00% |
14 | 14 | RIO GRANDE(AR) | 0 | 4 | 0.00% |
15 | 15 | CAMPANA | 0 | 2 | 0.00% |
16 | 16 | SAN MARTIN | 1 | 2 | 100.00% |
17 | 17 | COLONIA | 20 | 0 | -100.00% |
18 | 18 | CORRIENTES | 6 | 0 | -100.00% |
Graph source: DataLiner (To request a DataLiner demo click here)
-
Grains
Dec, 17, 2021
0
Argentina establishes regulations to control corn and wheat exports
-
Sugar and Ethanol
Dec, 29, 2022
0
Brazil expects to produce 4% more sugar
-
Meat
Sep, 13, 2023
0
Brazilian poultry eager to gain access to more markets in Africa
-
Meat
Oct, 06, 2021
0
Chicken meat exports grow 21.3% YoY in September