Ranking of Brazilian Ports and Plate | Jan to Nov | 2020 – 2021
Jan, 18, 2022 Posted by Gabriel MalheirosWeek 202203
Check below the ranking of Brazilian ports, as well as ports in the Plate region in terms of container handling in the first eleven months of 2021 and vis-a-vis the same period in 2020. Data are from DataLiner:
Brazil
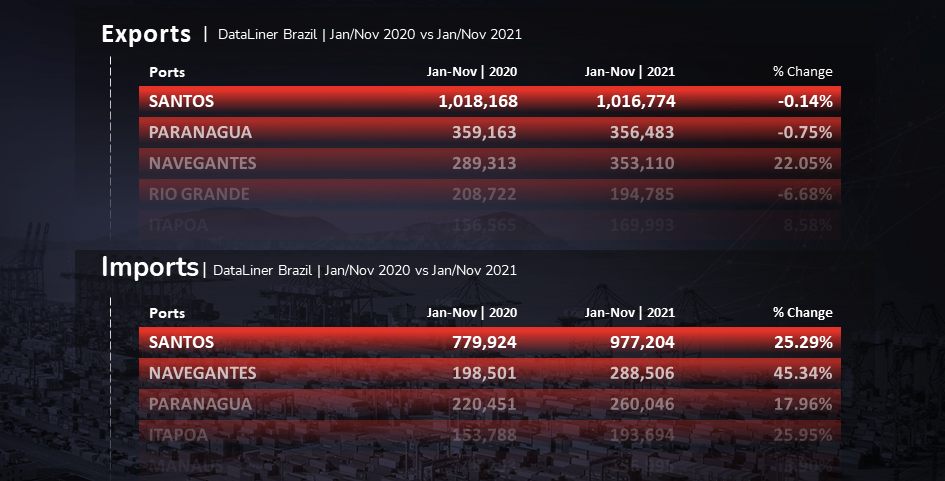
In terms of exports, the Port of Santos maintains its lead, with 0.14% in TEUs compared to the same period in 2020. Paranaguá, in second place, fell 0.75%. Navegantes ranked third, had a strong performance, increasing by 22.05 %. Proportionally, the Port of Fortaleza experienced the greatest growth: 54.55 %, with 25,443 TEU.
The Port of Itajaí saw the greatest decline in container exports, with a drop of 18.68 % to the first eleven months of 2020.
Ranking of Brazilian Ports | Exports | Jan/Nov 2021 vs Jan/Nov 2020 | TEU
wdt_ID | Rank | Ports | Jan-Nov | 2020 | Jan-Nov | 2021 | % Change |
---|---|---|---|---|---|
1 | 1 | SANTOS | 1,018,168 | 1,016,774 | -0.14% |
2 | 2 | PARANAGUA | 359,163 | 356,483 | -0.75% |
3 | 3 | NAVEGANTES | 289,313 | 353,110 | 22.05% |
4 | 4 | RIO GRANDE | 208,722 | 194,785 | -6.68% |
5 | 5 | ITAPOA | 156,565 | 169,993 | 8.58% |
6 | 6 | ITAJAI | 153,104 | 124,507 | -18.68% |
7 | 7 | SALVADOR | 87,599 | 80,528 | -8.07% |
8 | 8 | RIO DE JANEIRO | 85,913 | 79,867 | -7.04% |
9 | 9 | VITORIA | 67,897 | 66,809 | -1.60% |
10 | 10 | VILA DO CONDE | 47,619 | 49,539 | 4.03% |
11 | 11 | PECEM | 34,405 | 42,275 | 22.87% |
12 | 12 | FORTALEZA | 16,463 | 25,443 | 54.55% |
13 | 13 | SUAPE | 22,242 | 22,880 | 2.87% |
14 | 14 | ITAGUAI | 23,855 | 22,368 | -6.23% |
15 | 15 | NATAL | 22,570 | 20,698 | -8.29% |
16 | 16 | MANAUS | 13,198 | 16,111 | 22.07% |
17 | OTHERS | 880 | 857 | -2.61% |
Fonte: DataLiner (click here to request a demo)
When compared to the same period in 2020, imports at the Port of Santos increased by 25.29% in the first 11 months of 2021. From January to November 2021, the Port of Navegantes increased its container imports by 45.34%.
The Port of Itaguaí experienced the greatest decrease in container imports, importing 33.27 percent less.
Ranking of Brazilian Ports | Imports | Jan/Nov 2021 vs Jan/Nov 2020 | TEU
wdt_ID | Rank | Ports | Jan-Nov | 2020 | Jan-Nov | 2021 | % Change |
---|---|---|---|---|---|
1 | 1 | SANTOS | 779,924 | 977,204 | 25.29% |
2 | 2 | NAVEGANTES | 198,501 | 288,506 | 45.34% |
3 | 3 | PARANAGUA | 220,451 | 260,046 | 17.96% |
4 | 4 | ITAPOA | 153,788 | 193,694 | 25.95% |
5 | 5 | MANAUS | 148,253 | 156,995 | 5.90% |
6 | 6 | ITAJAI | 124,535 | 138,851 | 11.50% |
7 | 7 | RIO DE JANEIRO | 103,354 | 113,871 | 10.18% |
8 | 8 | SUAPE | 70,429 | 80,049 | 13.66% |
9 | 9 | SALVADOR | 60,510 | 67,184 | 11.03% |
10 | 10 | RIO GRANDE | 61,087 | 60,525 | -0.92% |
11 | 11 | VITORIA | 50,974 | 48,742 | -4.38% |
12 | 12 | PECEM | 34,062 | 27,468 | -19.36% |
13 | 13 | ITAGUAI | 21,898 | 14,613 | -33.27% |
14 | 14 | VILA DO CONDE | 7,588 | 5,992 | -21.03% |
15 | 15 | FORTALEZA | 1,402 | 1,797 | 28.17% |
16 | 16 | NATAL | 412 | 534 | 29.45% |
17 | OTHERS | 1,171 | 447 | -61.83% |
Source: DataLiner (click here to request a demo)
Plate
With the exception of the Port of La Plata, which increased its containers exports by 214.06% in the period from January to November 2021 compared to 2020, the ports of other Plate countries showed, for the most part, a drop in exports. Buenos Aires, the city with the highest recorded volume, saw a drop of 8.10% when compared to the same period in 2020. The Port of Montevideo, on the other hand, increased by 10%.
Ranking of Ports in the Plate region | Exports | Jan/Nov 2021 vs Jan/Nov 2020 | TEU
wdt_ID | Rank | Ports | Jan-Nov | 2020 | Jan-Nov | 2021 | % Change |
---|---|---|---|---|---|
1 | 1 | BUENOS AIRES | 391,837 | 360,102 | -8.10% |
2 | 2 | MONTEVIDEO | 191,747 | 210,924 | 10.00% |
3 | 3 | ZARATE | 29,665 | 33,870 | 14.17% |
4 | 4 | ROSARIO | 17,640 | 13,936 | -21.00% |
5 | 5 | SAN ANTONIO ESTE | 13,334 | 12,748 | -4.40% |
6 | 6 | PUERTO MADRYN | 7,235 | 4,087 | -43.51% |
7 | 7 | BAHIA BLANCA | 8,516 | 3,608 | -57.63% |
8 | 8 | LA PLATA | 697 | 2,189 | 214.06% |
Source: DataLiner (click here to request a demo)
Most ports in the Plate region grew in terms of imports. The Port of Buenos Aires increased the number of TEUs received by 10.76%. The second place in the ranking, the Port of Montevideo, grew 36.09% in the period.
Ranking of Ports in the Plate region | Imports | Jan/Nov 2021 vs Jan/Nov 2020 | TEU
wdt_ID | Rank | Ports | Jan-Nov | 2020 | Jan-Nov | 2021 | % Change |
---|---|---|---|---|---|
1 | 1 | BUENOS AIRES | 446,918 | 494,989 | 10.76% |
2 | 2 | MONTEVIDEO | 140,512 | 191,222 | 36.09% |
3 | 3 | ZARATE | 41,427 | 45,418 | 9.63% |
4 | 4 | ROSARIO | 18,468 | 23,083 | 24.99% |
5 | 5 | USHUAIA | 14,593 | 14,110 | -3.31% |
6 | 6 | PUERTO MADRYN | 1,802 | 1,747 | -3.05% |
7 | 7 | PUERTO DESEADO | 443 | 400 | -9.71% |
8 | 8 | BAHIA BLANCA | 219 | 191 | -12.79% |
9 | 9 | MAR DEL PLATA | 116 | 173 | 49.14% |
10 | 10 | SANTA FE | 42 | 121 | 188.10% |
11 | 11 | LAS PALMAS +AR | 17 | 114 | 570.59% |
12 | 12 | CAMPANA | 0 | 25 | 100.00% |
13 | 13 | LA PLATA | 4 | 22 | 450.00% |
-
Ports and Terminals
May, 06, 2024
0
Brazil: Public Consultation Launched for Amendment of Concession Contracts in Public Ports
-
Other Cargo
Mar, 21, 2022
0
Abrapa: Brazil imported 41k tonnes of cotton in the season so far
-
Ports and Terminals
Oct, 21, 2021
0
Companhia Docas do Ceará signs agreement with Argentina to move cargo through the Port of Mucuripe
-
Shipper/Freight Forwarders Rankings – commodity wise
Apr, 27, 2021
0
DSV Panalpina buys Agility unit for US$4 billion to become No. 3 freight forwarder