Ranking of Ports | DataLiner | Jan-Sep 2022 vs. Jan-Sep 2021 | Brazil and Plate
Nov, 24, 2022 Posted by Gabriel MalheirosWeek 202247
Please see below the ranking of ports in Brazil and the Plate region that most exported and imported containers in the first nine months of 2022 vis-a-vis the same period in 2021. All data come from DataLiner.
Brazil
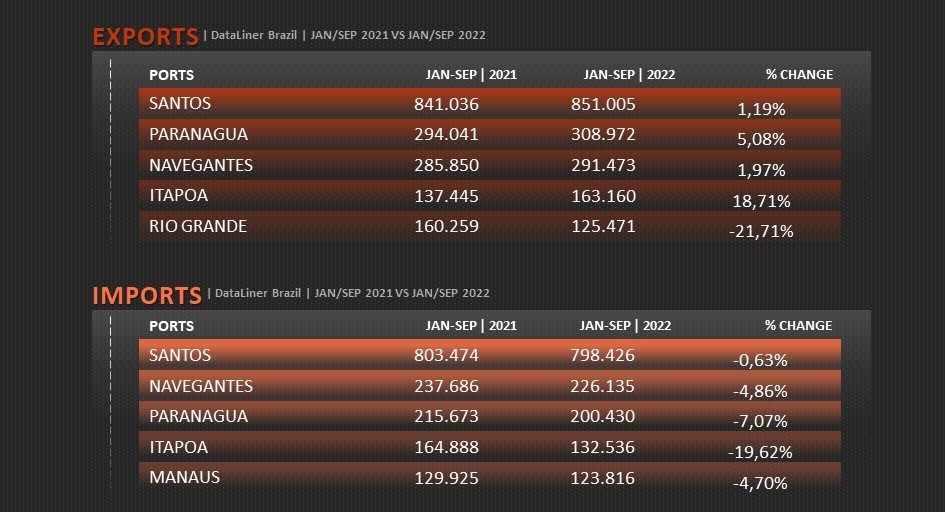
The Port of Santos leads the ranking of Brazilian containerized exports, with 851,005 TEUs from January to September 2022, a slight increase of 1.19% compared to the same period in 2021. The Port of Paranaguá, second in the ranking, exported a volume 5.08% higher in the same comparative frame. The Port of Itapoá ranked fourth, growing 18.71%. See more below:
Ranking of Brazilian Ports | Exports | Jan/Sep 2021 vs. Jan/ Sep 2022 | TEU
Source: DataLiner (click here to request a demo)
The Port of Santos leads in container imports with 798,426 TEUs brought in from January to September 2022, a slight decrease of 0.63% from the same period in 2021. In second place, the Port of Navegantes had a 4.86% lower container throughput than in the first nine months of 2021. The remainder of the ranking goes as follows:
Ranking of Brazilian Ports | Imports | Jan/ Sep 2021 vs. Jan/ Sep 2022 | TEU
Source: DataLiner (click here to request a demo)
Plate
As for the Plate countries (Argentina, Paraguay, and Uruguay), the Port of Buenos Aires was the port that held the most export activities from January to September 2022, with 277,486 TEUs, a drop of 7.28% compared to the same period in 2021. The Port of Montevideo, second in the ranking, shipped a volume 6.41% higher. See more below:
Ranking of Ports in the Plate region | Exports | Jan/ Sep 2021 vs. Jan/ Sep 2022 | TEU
Source: DataLiner (click here to request a demo)
The Port of Buenos Aires also leads in Plate container imports, with 424,192 TEUs brought from abroad from January to September 2022, a 2.18% increase over the same period in 2021. According to the ranking, the Port of Montevideo imported 7.72% more in the same period. Please find the complete chart below:
Ranking of Ports in the Plate region | Imports | Jan/ Sep 2021 vs. Jan/ Sep 2022 | TEU
-
Other Logistics
Apr, 08, 2020
0
Reconstruction work in progress on dolphin to protect pillar at Paraguay river bridge
-
Other Cargo
Jun, 27, 2023
0
Egg exports from Brazil grow 93.1% in 2023
-
Grains
Feb, 25, 2021
0
Study shows use of Panama Canal may reduce freight costs on ‘Northern Arc’ exports by 35%
-
Meat
Nov, 08, 2023
0
ABPA: Brazil’s January-October pork shipments see 9.6% increase

