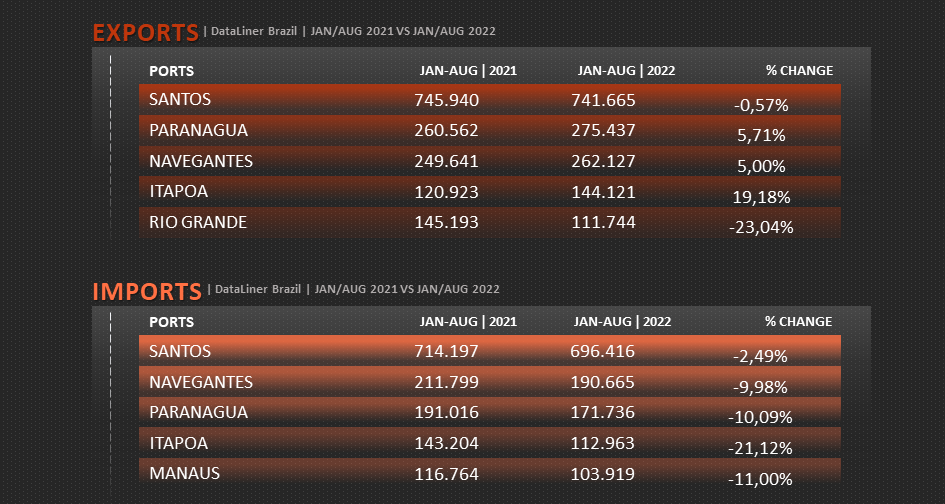
Ranking of Ports | Jan-Aug 2022 to Jan-Aug 2021 | Brazil and Plate
Oct, 26, 2022 Posted by Gabriel MalheirosWeek 202242
See below the ranking of Brazilian and Plate ports that most exported and imported containers in the first eight months of 2022 and its comparison to the same period in 2021. The data are from DataLiner.
Brazil
The Port of Santos maintained its top spot in the ranking of container exports in the first eight months of 2022, with 741,665 TEU, a slight decline of 0.57% from the volumes exported in the same period of 2021. In the same period, Paranaguá and Navegantes, who were ranked second and third, respectively, both experienced growth of 5%. See the others below:
Ranking of Brazilian Ports | Exports | Jan/Aug 2021 vs. Jan/Aug 2022 | TEU
wdt_ID Rank Ports Jan-Aug | 2021 Jan-Aug | 2022 % Change
1
1
SANTOS
745.940
741.665
-0.57%
2
2
PARANAGUA
260.562
275.437
5.71%
3
3
NAVEGANTES
249.641
262.127
5.00%
4
4
ITAPOA
120.923
144.121
19.18%
5
5
RIO GRANDE
145.193
111.744
-23.04%
6
6
ITAJAI
97.199
59.549
-38.73%
7
7
RIO DE JANEIRO
58.039
57.329
-1.22%
8
8
SALVADOR
53.790
46.513
-13.53%
9
9
VILA DO CONDE
39.561
35.691
-9.78%
10
10
VITORIA
46.596
34.323
-26.34%
11
11
PECEM
19.697
17.728
-10.00%
12
12
FORTALEZA
17.898
15.204
-15.05%
13
13
SUAPE
19.170
14.686
-23.39%
14
14
MANAUS
11.538
11.076
-4.00%
15
15
ITAGUAI
16.934
10.182
-39.87%
16
16
NATAL
10.621
9.755
-8.15%
17
OTHERS
620
447
-27.90%
18
TOTAL
1.913.923
1.847.578
-3.47%
Source: DataLiner (click here to request a demo)
In imports, the Port of Santos saw a movement of 696,416 TEUs from January to August, a decrease of 2.49% compared to the same period in 2021. The Port of Navegantes had a volume 9.98% lower in the same period, and Paranaguá -10.09%.
Ranking of Brazilian Ports | Imports | Jan/ Aug 2021 vs. Jan/ Aug 2022 | TEU
wdt_ID Rank Ports Jan-Aug | 2021 Jan-Aug | 2022 % Change
1
1
SANTOS
714.197
696.416
-2.49%
2
2
NAVEGANTES
211.799
190.665
-9.98%
3
3
PARANAGUA
191.016
171.736
-10.09%
4
4
ITAPOA
143.204
112.963
-21.12%
5
5
MANAUS
116.764
103.919
-11.00%
6
6
ITAJAI
105.149
85.563
-18.63%
7
7
RIO DE JANEIRO
82.715
81.687
-1.24%
8
8
SUAPE
59.941
53.849
-10.16%
9
9
SALVADOR
49.903
41.681
-16.48%
10
10
VITORIA
37.631
35.794
-4.88%
11
11
RIO GRANDE
47.191
33.320
-29.39%
12
12
PECEM
21.044
21.381
1.60%
13
13
ITAGUAI
12.749
5.250
-58.82%
14
14
VILA DO CONDE
4.636
3.842
-17.13%
15
15
FORTALEZA
1.369
763
-44.27%
16
16
IMBITUBA
37
208
462.16%
17
OTHERS
569
260
-54.31%
18
TOTAL
1.799.914
1.639.296
-8.92%
Source: DataLiner (click here to request a demo)
Plate
In the Plate region, while exports from the Port of Buenos Aires dropped by 5.1% in the first eight months of 2022 vis-a-vis 2021, the Port of Montevideo had an 11.71 larger throughput. See more below:
Ranking of Ports in the Plate region | Exports | Jan/ Aug 2021 vs. Jan/ Aug 2022 | TEU
wdt_ID Rank Ports Jan-Aug | 2021 Jan-Aug | 2022 % Change
1
1
BUENOS AIRES
261.369
248.039
-5.10%
2
2
MONTEVIDEO
146.900
164.102
11.71%
3
3
ZARATE
23.618
22.507
-4.70%
4
4
ROSARIO
10.395
6.988
-32.77%
5
5
SAN ANTONIO ESTE
12.748
4.719
-62.98%
6
6
LA PLATA
1.408
2.226
58.10%
7
7
MAR DEL PLATA
0
336
100.00%
8
8
PUERTO DESEADO
0
122
100.00%
9
9
PUERTO MADRYN
4.087
0
-100.00%
10
10
BAHIA BLANCA
3.608
0
-100.00%
11
TOTAL
464.134
449.038
-3.25%
Source: DataLiner (click here to request a demo)
In imports, the performance of the Port of Buenos Aires was 3.38% higher. The Port of Montevideo grew 12.56%. See below:
Ranking of Ports in the Plate region | Imports | Jan/ Aug 2021 vs. Jan/ Aug 2022 | TEU
wdt_ID | Rank | Ports | Jan-Aug | 2021 | Jan-Aug | 2022 | % Change |
---|---|---|---|---|---|
1 | 1 | BUENOS AIRES | 362.611 | 374.856 | 3.38% |
2 | 2 | MONTEVIDEO | 125.237 | 140.963 | 12.56% |
3 | 3 | ZARATE | 32.368 | 33.762 | 4.31% |
4 | 4 | ROSARIO | 16.776 | 19.523 | 16.38% |
5 | 5 | USHUAIA | 11.250 | 7.111 | -36.79% |
6 | 6 | VILLETA | 6.638 | 5.209 | -21.53% |
7 | 7 | PUERTO MADRYN | 1.217 | 1.115 | -8.38% |
8 | 8 | PUERTO DESEADO | 285 | 231 | -18.95% |
9 | 9 | SANTA FE | 65 | 117 | 80.00% |
10 | 10 | BAHIA BLANCA | 148 | 73 | -50.68% |
11 | OTHERS | 307 | 135 | -56.03% | |
12 | TOTAL | 556.901 | 583.095 | 4.70% |
-
Grains
Mar, 14, 2024
0
Agribusiness slows down, affects supply chain
-
Blog News (ENG)
Nov, 17, 2022
0
Still short from 2021, fresh fruit exports head to a promising close in 2022
-
DW 2019 EN
May, 27, 2019
0
DatamarWeek 28 May 2019
-
Ports and Terminals
Sep, 06, 2021
0
ANTAQ registers 8.44% YTD increase in port handling