TEU ranking of Brazil exports and imports in 2020
Feb, 24, 2021 Posted by Ruth HollardWeek 202108
Which goods were handled in the highest volumes in 2020? Which products had the greatest growth in exports? And the biggest drop? To answer these questions, the DatamarNews team conducted a ranking of the most-exported and most-imported goods in 2020 and drew a comparison with 2019. See the results below:
Exports
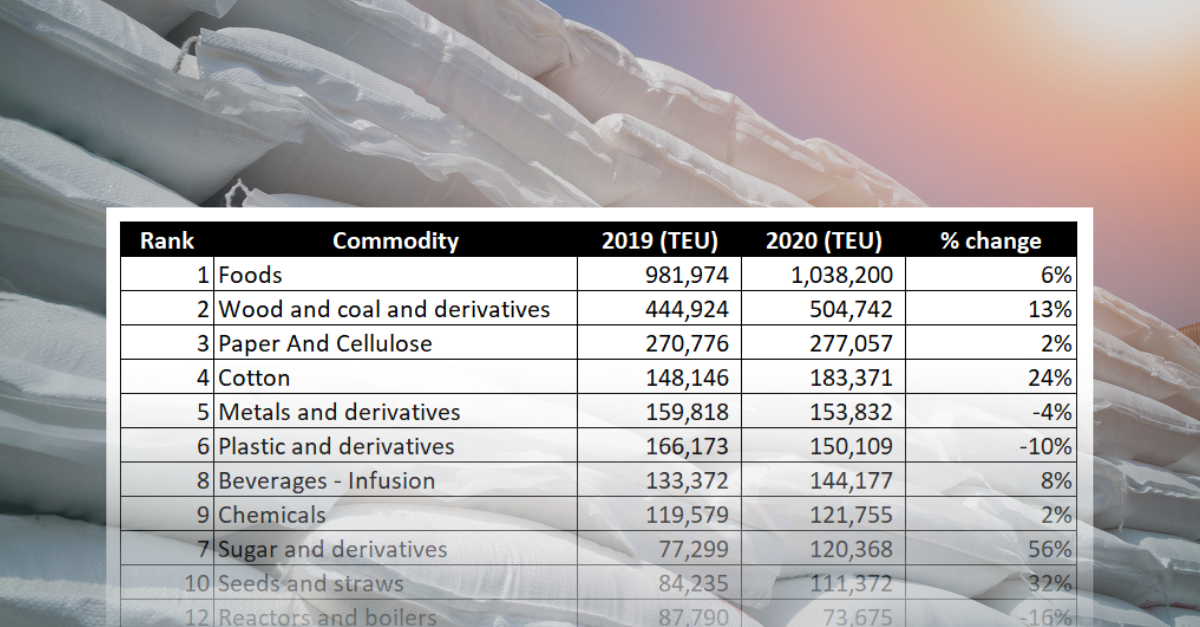
In exports, food was the category that performed the best in 2020, with 1,038,200 TEU, a growth of 6% in relation to 2019. The highest percentage growth, however, was registered in the ‘sugar and derivatives’ category, which grew 56%.
Ranking of Brazil’s exports | Jan to December 2019-2020 | TEU
wdt_ID | Rank | Commodity | 2019 (TEU) | 2020 (TEU) | % change |
---|---|---|---|---|---|
1 | 1 | Foods | 981.974 | 1.038.200 | 6% |
2 | 2 | Wood and coal and derivatives | 444.924 | 504.742 | 13% |
3 | 3 | Paper And Cellulose | 270.776 | 277.057 | 2% |
4 | 4 | Cotton | 148.146 | 183.371 | 24% |
5 | 5 | Metals and derivatives | 159.818 | 153.832 | -4% |
6 | 6 | Plastic and derivatives | 166.173 | 150.109 | -10% |
7 | 8 | Beverages - Infusion | 133.372 | 144.177 | 8% |
8 | 9 | Chemicals | 119.579 | 121.755 | 2% |
9 | 7 | Sugar and derivatives | 77.299 | 120.368 | 56% |
10 | 10 | Seeds and straws | 84.235 | 111.372 | 32% |
11 | 12 | Reactors and boilers | 87.790 | 73.675 | -16% |
12 | 11 | Animal food | 68.583 | 71.516 | 4% |
13 | 14 | Textiles, derivatives and clothing | 68.151 | 66.564 | -2% |
14 | 13 | Smoke | 60.786 | 57.832 | -5% |
15 | 15 | Minerals and derivatives | 54.157 | 56.099 | 4% |
16 | Total | 2.925.763 | 3.130.669 | 7% | |
17 | Others | 474.542 | 451.321 | -5% | |
18 | Grand total | 3.400.305 | 3.581.990 | 5% |
Source: DataLiner
Imports
The goods most imported by Brazil in containers in 2020 were from the ‘plastics and derivatives’ category. At 377,538 TEU, this was a 6% growth compared to 2019. In contrast, the ‘rubbers and derivatives’ category fell 18% in 2020 compared to 2019.
Ranking of Brazil’s imports | Jan to December 2019-2020 | TEU
wdt_ID | Rank | Commodity | 2019 (TEU) | 2020 (TEU) | % change |
---|---|---|---|---|---|
1 | 1 | Plastic and derivatives | 357.173 | 377.538 | 6% |
2 | 2 | Chemicals | 337.491 | 348.558 | 3% |
3 | 3 | Reactors and boilers | 343.456 | 311.032 | -9% |
4 | 4 | Without classification | 225.487 | 258.681 | 15% |
5 | 5 | Vehicles and parts | 351.535 | 241.587 | -31% |
6 | 6 | Electric machines | 239.703 | 232.920 | -3% |
7 | 7 | Metals and derivatives | 214.962 | 198.619 | -8% |
8 | 8 | Textiles, derivatives and clothing | 209.254 | 175.508 | -16% |
9 | 9 | Foods | 120.765 | 121.589 | 1% |
10 | 10 | Rubber and derivatives | 133.522 | 109.187 | -18% |
11 | 11 | Paper And Cellulose | 99.072 | 92.105 | -7% |
12 | 12 | Fertilizer | 61.418 | 70.700 | 15% |
13 | 13 | Furniture | 59.485 | 52.375 | -12% |
14 | 14 | Drinks | 46.908 | 44.527 | -5% |
15 | 15 | Glass and derivatives | 52.159 | 43.588 | -16% |
16 | Total | 2.852.390 | 2.678.514 | -6% | |
17 | Others | 343.396 | 339.172 | -1% | |
18 | Grand total | 3.195.786 | 3.017.686 | -6% |
Source: DataLiner (To request a DataLiner demo click here)
-
Meat
Aug, 18, 2022
0
Brazil pork exports 59% of the volume in Aug 2021 in just 10 working days
-
Shipping
Jul, 01, 2024
0
Svitzer Invests In Three New Tugboats In Brazil To Support Growth
-
Grains
Jun, 10, 2021
0
Grain crop should reach 262 million tons
-
Ports and Terminals
Apr, 07, 2022
0
Port of Santos’ terminals will clear yards to ease truck traffic on the roads