Update on maritime trade lane performance between Brazil and rest of world during 2020
Oct, 21, 2020 Posted by Ruth HollardWeek 202044
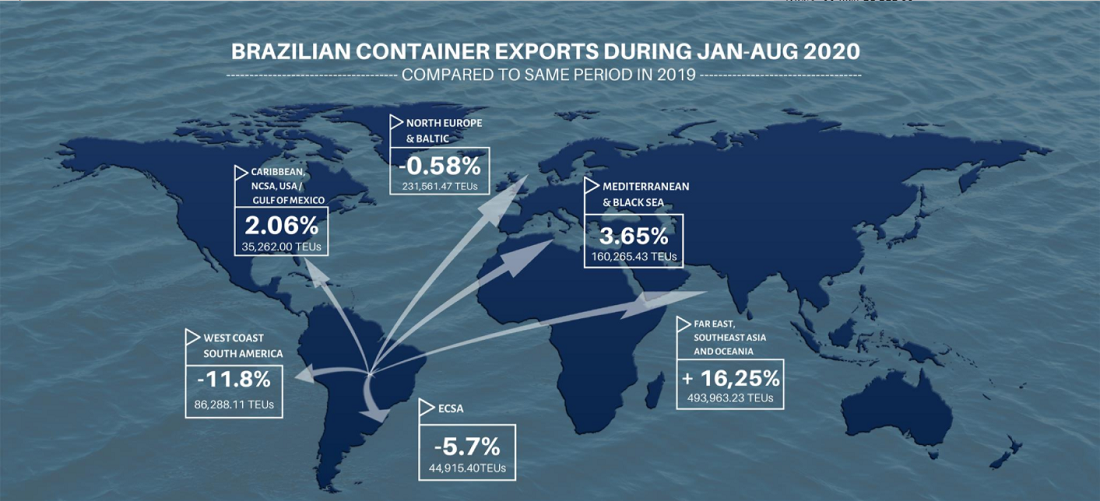
Dataliner data indicates that there was growth in exports from the main trade groups. Despite this, there was a drop in imports. See details below:
Mediterranean and Black Sea
In this trade lane, exports grew 3.65% in the period from January to August 2020 compared to the same period in 2019, with 160,265.43 TEUs. Imports, on the other hand, fell 9.92%.
Mediterranean & Black Sea Imports and Exports – Jan 2006 to Aug 2020 (TEU)
Source: DataLiner
Far East & Southeast Asia
Exports in this trade lane performed well, showing a growth of 16.25%. Imports, on the other hand, fell 13.91%.
Far East and Southeast Asia Imports and Exports – Jan 2006 to Aug 2020 (TEU)
Source: DataLiner
Northern Europe and the Baltic region
Here there was a decrease of 0.58% in exports in the period from January to August compared to the same period in 2019. Imports also registered negative numbers, with a decrease of 9.57%.
Northern Europe and Baltic Region Imports and Exports – Jan 2006 to Aug 2020 (TEU)
Source: DataLiner
Southeast Africa, Middle East, and Indian subcontinent
Exports in this region grew by 8.66%, while imports fell 32.23%.
South and East Africa Imports and Exports – Jan 2006 to Aug 2020 (TEU)
Source: DataLiner
Western Africa
There was considerable growth in exports in the trade lanes in this region in the first eight months of 2020 compared to the same period in 2019: + 21.12%. On the other hand, imports fell 40.7%.
West Africa Imports and Exports – Jan 2006 to Aug 2020 (TEU)
Source: DataLiner
Caribbean, NCSA, and USA / Gulf of Mexico
In this region’s trade lanes, there was a slight growth in exports of 2.06% offset by imports which fell by 31.33%.
Caribbean Imports and Exports – Jan 2006 to Aug 2020 (TEU)
Source: DataLiner
South America West Coast
This trade lane registered an 11.08% drop in exports in the period from January to August 2020 compared to the same period in 2019. Imports also fell, by 10.42%.
West Coast South America Imports and Exports – Jan 2006 to Aug 2020 (TEU)
Source: DataLiner
ECSA
In the ECSA region, the drop in exports was 5.7% or 44,915.40 TEUs. The fall in imports was greater: -12.89%.
ECSA Imports and Exports – Jan 2006 to Aug 2020 (TEU)
Source: DataLiner
WCNA / WCCA
In the WCNA/WCCA trade lane, exports grew by 13.21% in the period from January to August 2020 in relation to the previous year. Imports fell slightly, by 0.21%.
West Coast North America Imports and Exports – Jan 2006 to Aug 2020 (TEU)
Source: DataLiner
ECNA
There was modest growth in exports in the East Coast North America trade lane, of + 2.61%. Imports, on the other hand, fell by 12.08%.
ECNA Imports and Exports – Jan 2006 to Aug 2020 (TEU)
Source: DataLiner (to order a DataLiner demo click here)
-
Other Logistics
Feb, 22, 2019
0
Bolsonaro tweets infrastructure reform proposals
-
Grains
Apr, 01, 2024
0
Brazil witness largest rice import volume in almost two decades
-
Ports and Terminals
Mar, 06, 2024
0
ANTAQ Sets Date for Public Hearing on Itajaí Port Concession
-
Sugar and Ethanol
Oct, 13, 2021
0
China maintains sugar import quota for 2022 at 1.945m tons

