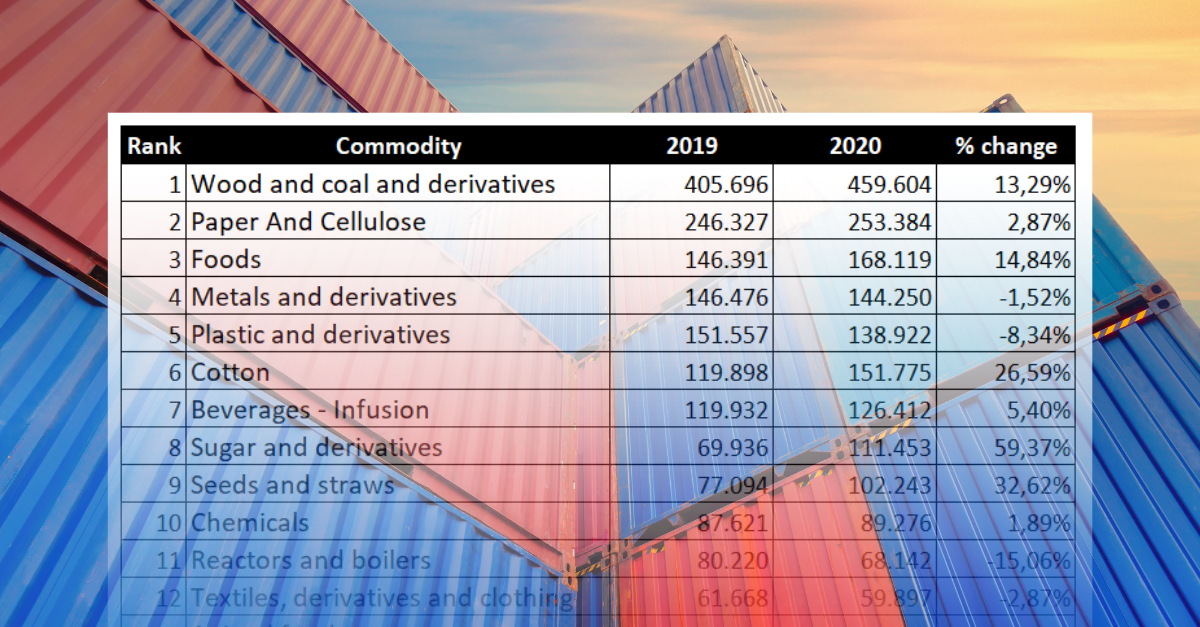
Dry-cargo container rankings | Jan to Nov 2019-2020
Jan, 27, 2021 Posted by Ruth HollardWeek 202104
The handling of dry-cargo containers can be considered a thermometer of a country’s economy. Therefore, the DatamarNews team prepared a ranking of Brazil’s most exported and imported goods via dry-cargo container in this atypical year of 2020 (Jan to Nov 2020). The result is shown below:
Despite economic uncertainties, exports via dry-cargo containers grew 5.78% in the period from January to November 2020 compared to the same period in 2019. Imports, however, fell 8.37% in the same comparison. It is worth noting that the high dollar favored exports and affected imports, as shown in the graph below:
Brazilian Dry-Cargo Container Handling | Jan 2017 to Nov 2020 | TEU
Source: DataLiner
Exports
Wood and coal and its derivatives led dry-cargo container exports, which grew 13% in the period from January to November 2020 compared to 2019. Other highlights are cotton, which grew 27%, and sugars, which grew 59%.
Ranking of Dry-Cargo Container Exports | Jan to Nov 2019-2020 | TEU
| wdt_ID | Rank | Commodity | 2019 | 2020 | % change |
|---|---|---|---|---|---|
| 1 | 1 | Wood and coal and derivatives | 405.696 | 459.604 | 13% |
| 2 | 2 | Paper And Cellulose | 246.327 | 253.384 | 3% |
| 3 | 3 | Foods | 146.391 | 168.119 | 15% |
| 4 | 4 | Metals and derivatives | 146.476 | 144.250 | -2% |
| 5 | 5 | Plastic and derivatives | 151.557 | 138.922 | -8% |
| 6 | 6 | Cotton | 119.898 | 151.775 | 27% |
| 7 | 7 | Beverages - Infusion | 119.932 | 126.412 | 5% |
| 8 | 8 | Sugar and derivatives | 69.936 | 111.453 | 59% |
| 9 | 9 | Seeds and straws | 77.094 | 102.243 | 33% |
| 10 | 10 | Chemicals | 87.621 | 89.276 | 2% |
| 11 | 11 | Reactors and boilers | 80.220 | 68.142 | -15% |
| 12 | 12 | Textiles, derivatives and clothing | 61.668 | 59.897 | -3% |
| 13 | 13 | Animal food | 57.129 | 60.118 | 5% |
| 14 | 14 | Smoke | 56.668 | 51.423 | -9% |
| 15 | 15 | Minerals and derivatives | 50.273 | 51.015 | 1% |
| 16 | 16 | Rubber and derivatives | 53.345 | 41.742 | -22% |
| 17 | 17 | Vehicles and parts | 48.369 | 35.749 | -26% |
| 18 | 18 | Ceramics | 42.056 | 40.075 | -5% |
| 19 | 19 | Furniture | 28.444 | 30.672 | 8% |
| 20 | 20 | Electric machines | 25.752 | 24.993 | -3% |
| 21 | Total | 2.074.853 | 2.209.266 | 6% | |
| 22 | Others | 190.536 | 187.071 | -2% | |
| 23 | Grand total | 2.265.389 | 2.396.337 | 6% |
Source: DataLiner
Imports
In terms of imports, there was a drop in the accumulated volume of all goods. In addition, imports of fertilizer grew 16% in the period and food imports grew 11%.
Ranking of Dry-Cargo Container Imports| Jan to Nov 2019-2020 | TEU
| wdt_ID | Rank | Commodity | 2019 | 2020 | % change |
|---|---|---|---|---|---|
| 1 | 1 | Plastic and derivatives | 319.961 | 329.068 | 3% |
| 2 | 2 | Reactors and boilers | 314.256 | 293.442 | -7% |
| 3 | 3 | Vehicles and parts | 323.747 | 235.179 | -27% |
| 4 | 4 | Chemicals | 277.238 | 280.846 | 1% |
| 5 | 5 | Electric machines | 217.954 | 217.176 | -0% |
| 6 | 6 | Metals and derivatives | 196.445 | 177.319 | -10% |
| 7 | 7 | Textiles, derivatives and clothing | 190.793 | 155.332 | -19% |
| 8 | 8 | Rubber and derivatives | 121.384 | 97.750 | -19% |
| 9 | 9 | Paper And Cellulose | 91.613 | 84.011 | -8% |
| 10 | 10 | Fertilizer | 55.854 | 65.069 | 16% |
| 11 | 11 | Furniture | 54.270 | 47.167 | -13% |
| 12 | 12 | Glass and derivatives | 47.446 | 39.400 | -17% |
| 13 | 13 | Foods | 38.561 | 42.970 | 11% |
| 14 | 14 | Drinks | 40.345 | 37.790 | -6% |
| 15 | 15 | Salt, plaster, cement | 36.143 | 38.936 | 8% |
| 16 | 16 | Toys | 39.761 | 30.506 | -23% |
| 17 | 17 | Paints | 25.570 | 25.078 | -2% |
| 18 | 18 | Fuel | 20.299 | 23.429 | 15% |
| 19 | 19 | Optical and photography instruments | 21.329 | 19.928 | -7% |
| 20 | 20 | Ceramics | 16.976 | 13.687 | -19% |
| 21 | Total | 2.449.945 | 2.254.085 | -8% | |
| 22 | Others | 328.483 | 291.573 | -11% | |
| 23 | Grand total | 2.778.429 | 2.545.658 | -8% |
Source: DataLiner (To request a DataLiner demo click here)
-
Automotive
Apr, 02, 2019
0
Car sales in Argentina fall 50% in first quarter of 2019
-
Other Cargo
Aug, 01, 2022
0
H1 Brazilian steel exports to Europe skyrocket 710% on year amid war in Ukraine
-
Ports and Terminals
Feb, 17, 2021
0
Cargo handling at the Port of Recife grows 69% in January
-
Other Logistics
Sep, 05, 2022
0
Santos Port Authority issues call for bids for internal railway tender


