Ranking of Ports | DataLiner | Jan-Oct 2022 vs. Jan-Oct 2021 | Brazil and Plate
Dec, 27, 2022 Posted by Gabriel MalheirosWeek 202252
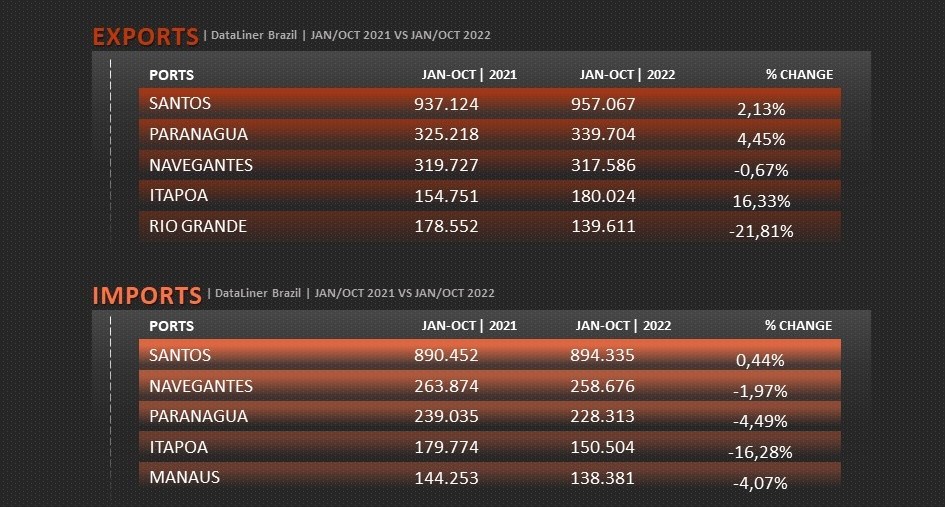
See below the ranking of Brazilian and Plate ports that most exported and imported containers in the first ten months of 2022 compared with the same period of 2021. The data is from DataLiner:
Brazil
The Port of Santos leads the ranking of Brazilian exports via containers, with 957,067 TEUs moved between January and October 2022, an increase of 2.13% compared to the same period in 2021. The Port of Paranagua, second in the ranking, saw a volume 4.45% higher in the same time frame. See the others below:
Ranking of Brazilian Ports | Exports | Jan/Oct 2021 vs. Jan/ Oct 2022 | TEU
wdt_ID Rank Ports Jan-Oct | 2021 Jan-Oct | 2022 % Change
1
1
SANTOS
937.124
957.067
2.13%
2
2
PARANAGUA
325.218
339.704
4.45%
3
3
NAVEGANTES
319.727
317.586
-0.67%
4
4
ITAPOA
154.751
180.024
16.33%
5
5
RIO GRANDE
178.552
139.611
-21.81%
6
6
ITAJAI
115.923
73.788
-36.35%
7
7
RIO DE JANEIRO
71.466
72.003
0.75%
8
8
SALVADOR
72.643
65.038
-10.47%
9
9
VITORIA
60.328
44.652
-25.98%
10
10
VILA DO CONDE
46.305
43.259
-6.58%
11
11
PECEM
33.982
27.749
-18.34%
12
12
FORTALEZA
22.504
19.398
-13.80%
13
13
SUAPE
22.960
17.457
-23.97%
14
14
NATAL
17.970
16.329
-9.13%
15
15
MANAUS
14.279
13.482
-5.58%
16
16
ITAGUAI
20.535
13.387
-34.81%
17
OTHERS
797
511
-35.88%
18
TOTAL
2.415.064
2.341.045
-3.06%
Source: DataLiner (click here to request a demo)
In Brazilian imports via containers, the Port of Santos, first in the ranking, had 894,335 TEUs throughout, a volume 0.44% greater than that of the same period in 2021. On the other hand, Navegantes, which occupies the second position, imported 1.97% less. See below:
Ranking of Brazilian Ports | Imports | Jan/ Oct 2021 vs. Jan/ Oct 2022 | TEU
| wdt_ID | Rank | Portos | Jan-Oct | 2021 | Jan-Oct | 2022 | % Change |
|---|---|---|---|---|---|
| 1 | 1 | SANTOS | 890.452 | 894.335 | 0.44% |
| 2 | 2 | NAVEGANTES | 263.874 | 258.676 | -1.97% |
| 3 | 3 | PARANAGUA | 239.035 | 228.313 | -4.49% |
| 4 | 4 | ITAPOA | 179.774 | 150.504 | -16.28% |
| 5 | 5 | MANAUS | 144.253 | 138.381 | -4.07% |
| 6 | 6 | ITAJAI | 127.422 | 110.749 | -13.09% |
| 7 | 7 | RIO DE JANEIRO | 103.505 | 104.882 | 1.33% |
| 8 | 8 | SUAPE | 73.415 | 70.238 | -4.33% |
| 9 | 9 | SALVADOR | 61.571 | 52.758 | -14.31% |
| 10 | 10 | VITORIA | 45.084 | 49.507 | 9.81% |
| 11 | 11 | RIO GRANDE | 56.478 | 43.364 | -23.22% |
| 12 | 12 | PECEM | 25.388 | 28.492 | 12.23% |
| 13 | 13 | ITAGUAI | 14.141 | 7.306 | -48.33% |
| 14 | 14 | VILA DO CONDE | 5.443 | 4.966 | -8.76% |
| 15 | 15 | FORTALEZA | 1.709 | 956 | -44.03% |
| 16 | 16 | IMBITUBA | 37 | 394 | 964.86% |
| 17 | OTHERS | 875 | 329 | -62.40% | |
| 18 | TOTAL | 2.232.456 | 2.144.151 | -3.96% |
Source: DataLiner (click here to request a demo)
Plate (Paraguay, Uruguay, and Argentina)
The Port of Buenos Aires leads in container exports in the Plate region, having secured a throughput of 307,175 TEUs between January and October 2022, a drop of 6.88% compared to the same period in 2021. The Port of Montevideo, second in the ranking, exported a volume 3.34% higher.
Ranking of Ports in the Plate region | Exports | Jan/ Oct 2021 vs. Jan/ Oct 2022 | TEU
| wdt_ID | Rank | Ports | Jan-Oct | 2021 | Jan-Oct | 2022 | % Change |
|---|---|---|---|---|---|
| 1 | 1 | BUENOS AIRES | 329.878 | 307.175 | -6.88% |
| 2 | 2 | MONTEVIDEO | 194.342 | 200.826 | 3.34% |
| 3 | 3 | ZARATE | 29.867 | 26.257 | -12.09% |
| 4 | 4 | ROSARIO | 12.744 | 8.670 | -31.97% |
| 5 | 5 | SAN ANTONIO ESTE | 12.748 | 4.719 | -62.98% |
| 6 | 6 | LA PLATA | 1.802 | 2.959 | 64.21% |
| 7 | 7 | MAR DEL PLATA | 0 | 336 | 100.00% |
| 8 | 8 | PUERTO DESEADO | 0 | 122 | 100.00% |
| 9 | 9 | PUERTO MADRYN | 4.087 | 0 | -100.00% |
| 10 | 10 | BAHIA BLANCA | 3.608 | 0 | -100.00% |
| 11 | TOTAL | 589.076 | 551.064 | -6.45% |
Source: DataLiner (click here to request a demo)
In imports via containers, the Port of Buenos Aires has the regional lead with 471,423 TEUs moved, a growth of 3.53% compared to the same period in 2021. The Port of Montevideo, second in the ranking, saw a volume 5.09% higher in the same comparison. Check the rest of the ranking below:
-
Ports and Terminals
Jun, 27, 2019
0
Cargo movement at Santos sets new record for May
-
Ports and Terminals
Dec, 11, 2023
0
Grain exports from Brazilian Amazon to reach 55 million tonnes in 2023
-
Trade Regulations
Nov, 22, 2022
0
Arab Brazilian Chamber, Egypt Customs sign action plan
-
Other Logistics
May, 12, 2022
0
Brazil’s Galvani to Expand Fertilizer Output Just in Time


